Gallery
This is a gallery of some things you can do in ThermoParser with brief explanations. More details on each of the plots, including the scripts and specific commands used are available by clicking on the figures, and we also have tutorials!
The data files provided are mostly from published work1, which looks at the effectiveness of four transparent conducting oxides (TCOs) as thermoelectrics. Using a pre-release version of this code, the main problem was found to be their large lattice thermal conductivities, contributed to most by their low-frequency modes which have large mean free paths and group velocities. This is old work, and at the time the constant relaxation time approximation (CRTA) via BoltzTraP was used to calculate the electronic transport properties. Since then, we have recalculated the properties with the momentum relaxation time approximation (MRTA) via AMSET, and found using explicit electronic relaxation times via MRTA significantly alters the results. This is both due to the inclusion of more realistic scattering trends with temperature and carrier concentration (average-rates), and the ability to alter the electronic scattering rates rather than just the phononic ones when simulating nanostructuring. This leads to a much reduced electrical conductivity in BaSnO3, and therefore a much lower ZT (ztdiff), although these trends will vary significantly by material.
Note:
Some examples require large data files to run, which haven’t been
included in the data folder, but can be downloaded using the
get-data.sh script provided in the examples directory. If wget doesn’t
work for you, navigate to the URL (repo in get-data.sh) in your
browser to download the required file and add it to the ../data
directory (f in get-data.sh).
Hint
Click on the images to see the script which generated them.
At its simplest, ThermoParser is a way to quickly plot useful data
from either a python script or the command line, such as the classic
ztmap heatmap (the power factor pfmap is also available):
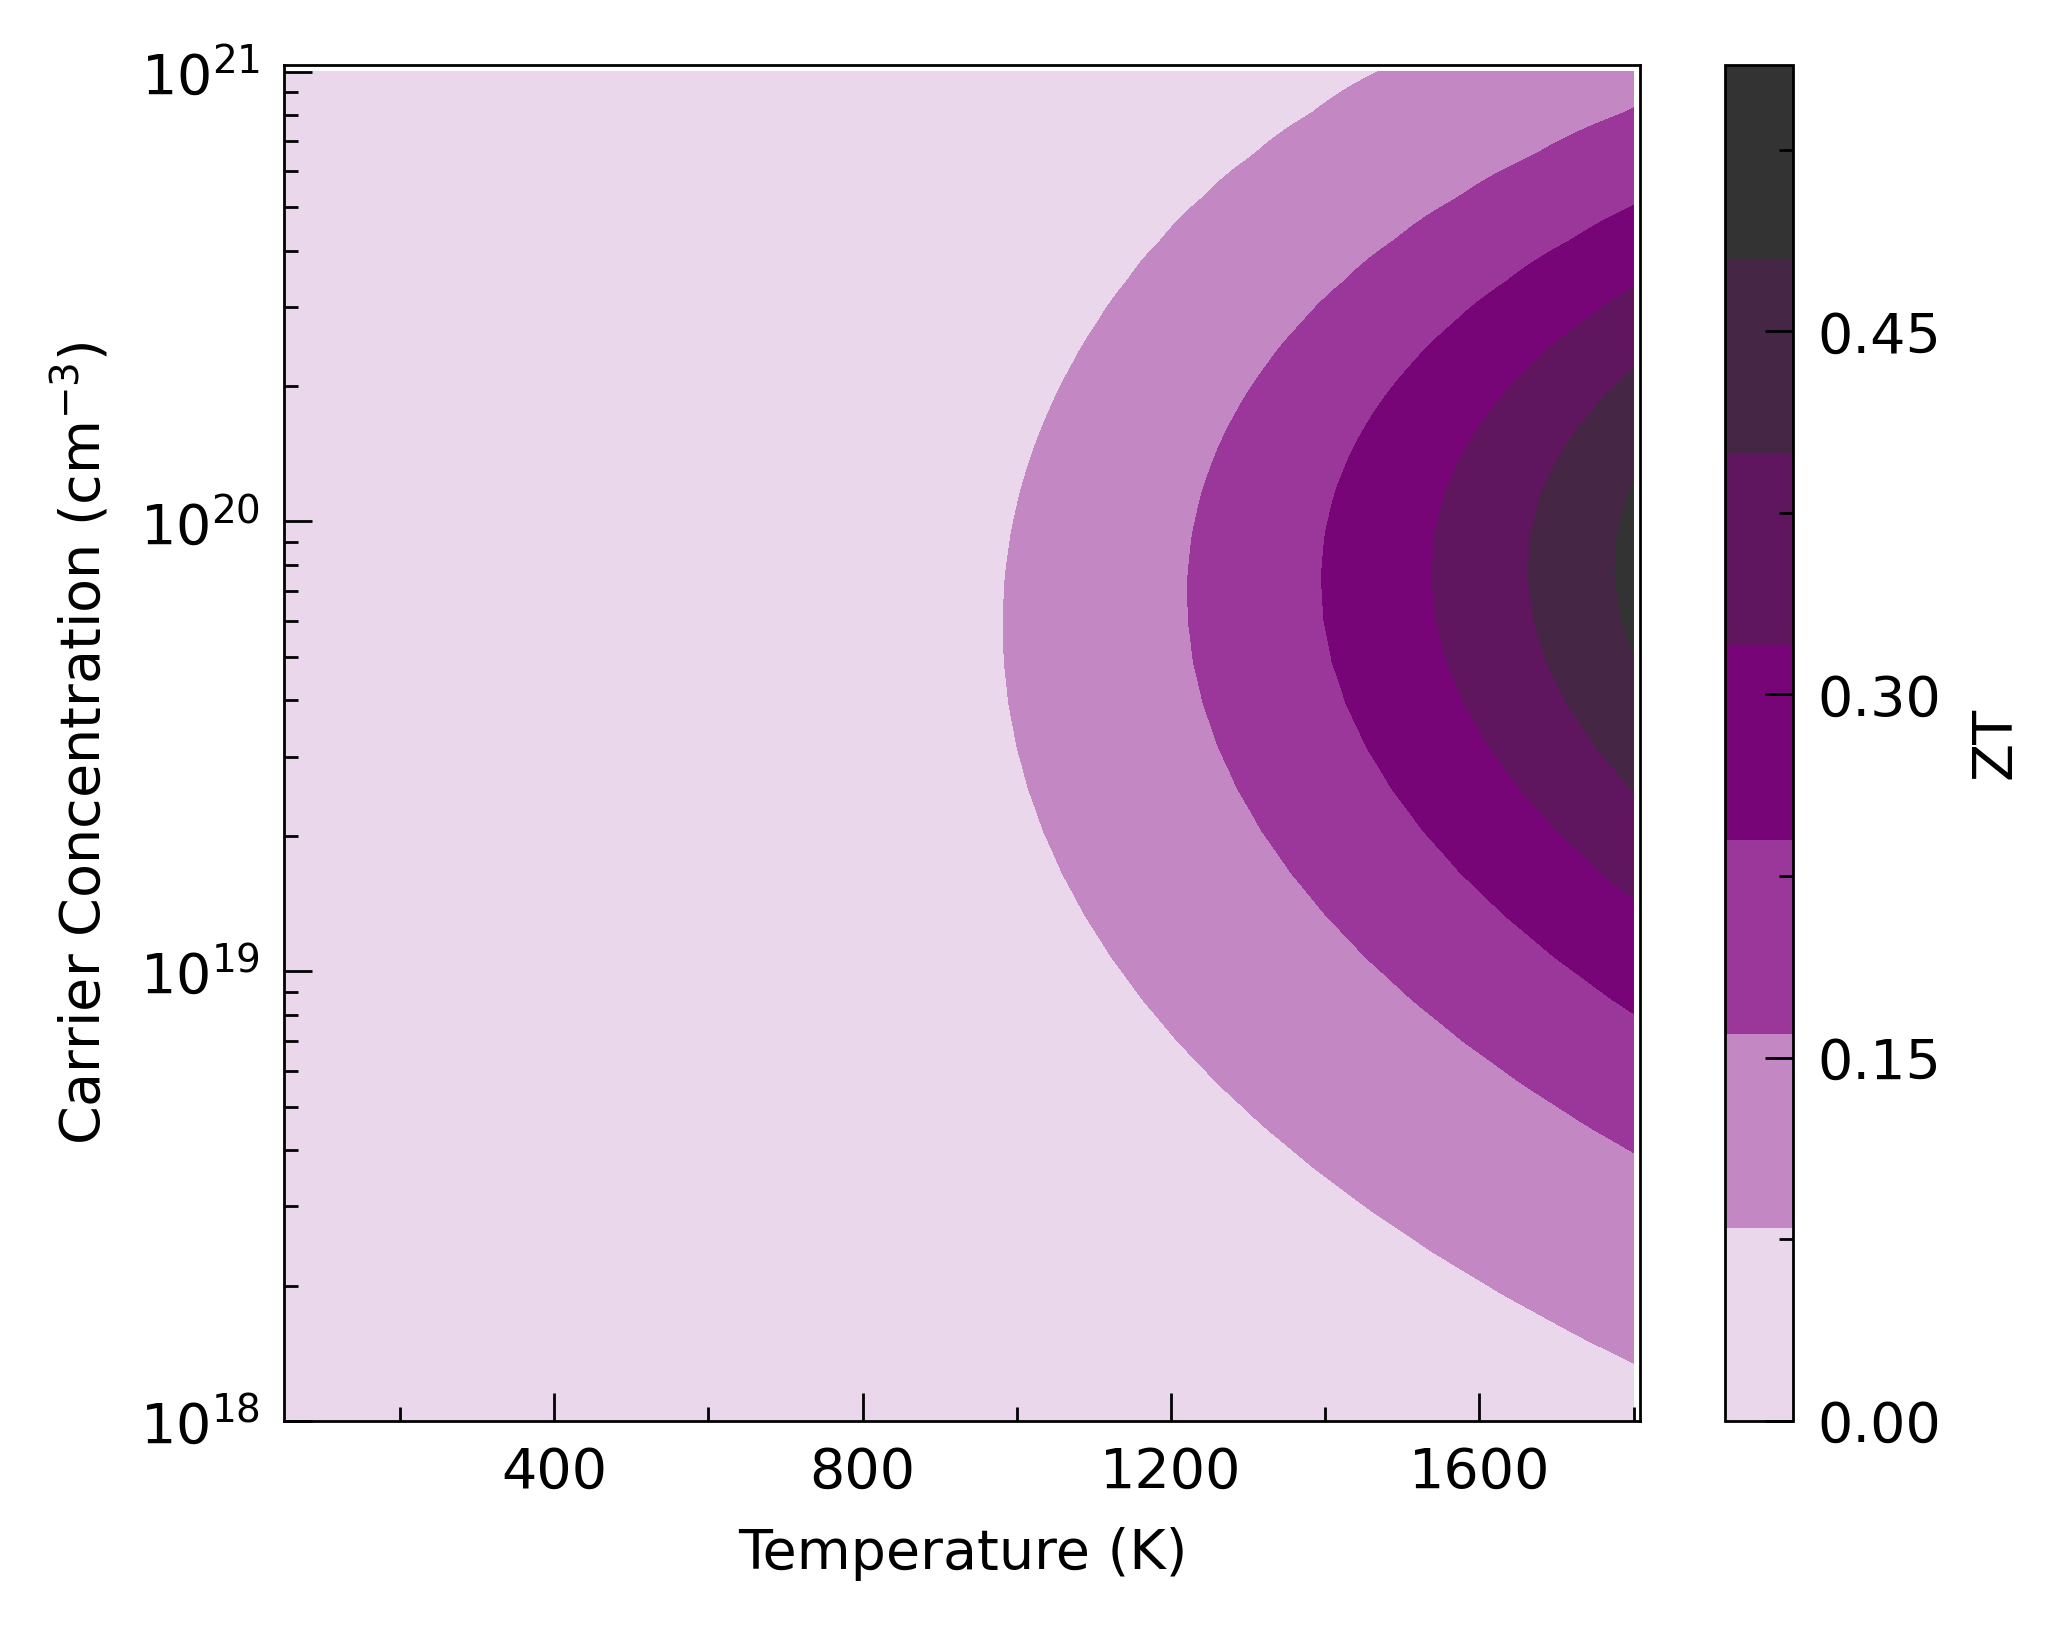
Click on the plot to see the script, or one could use
tp plot ztmap ../data/zno/boltztrap.hdf5 -k ../data/zno/kappa-m404021.hdf5 -c '#800080' -d x --discrete
A related plot we hope people find useful for screening materials to
run three+ phonon calculations on is the kappa-target plot, which
calculates the lattice thermal conductivity required to reach a given
ZT, in this case 2.
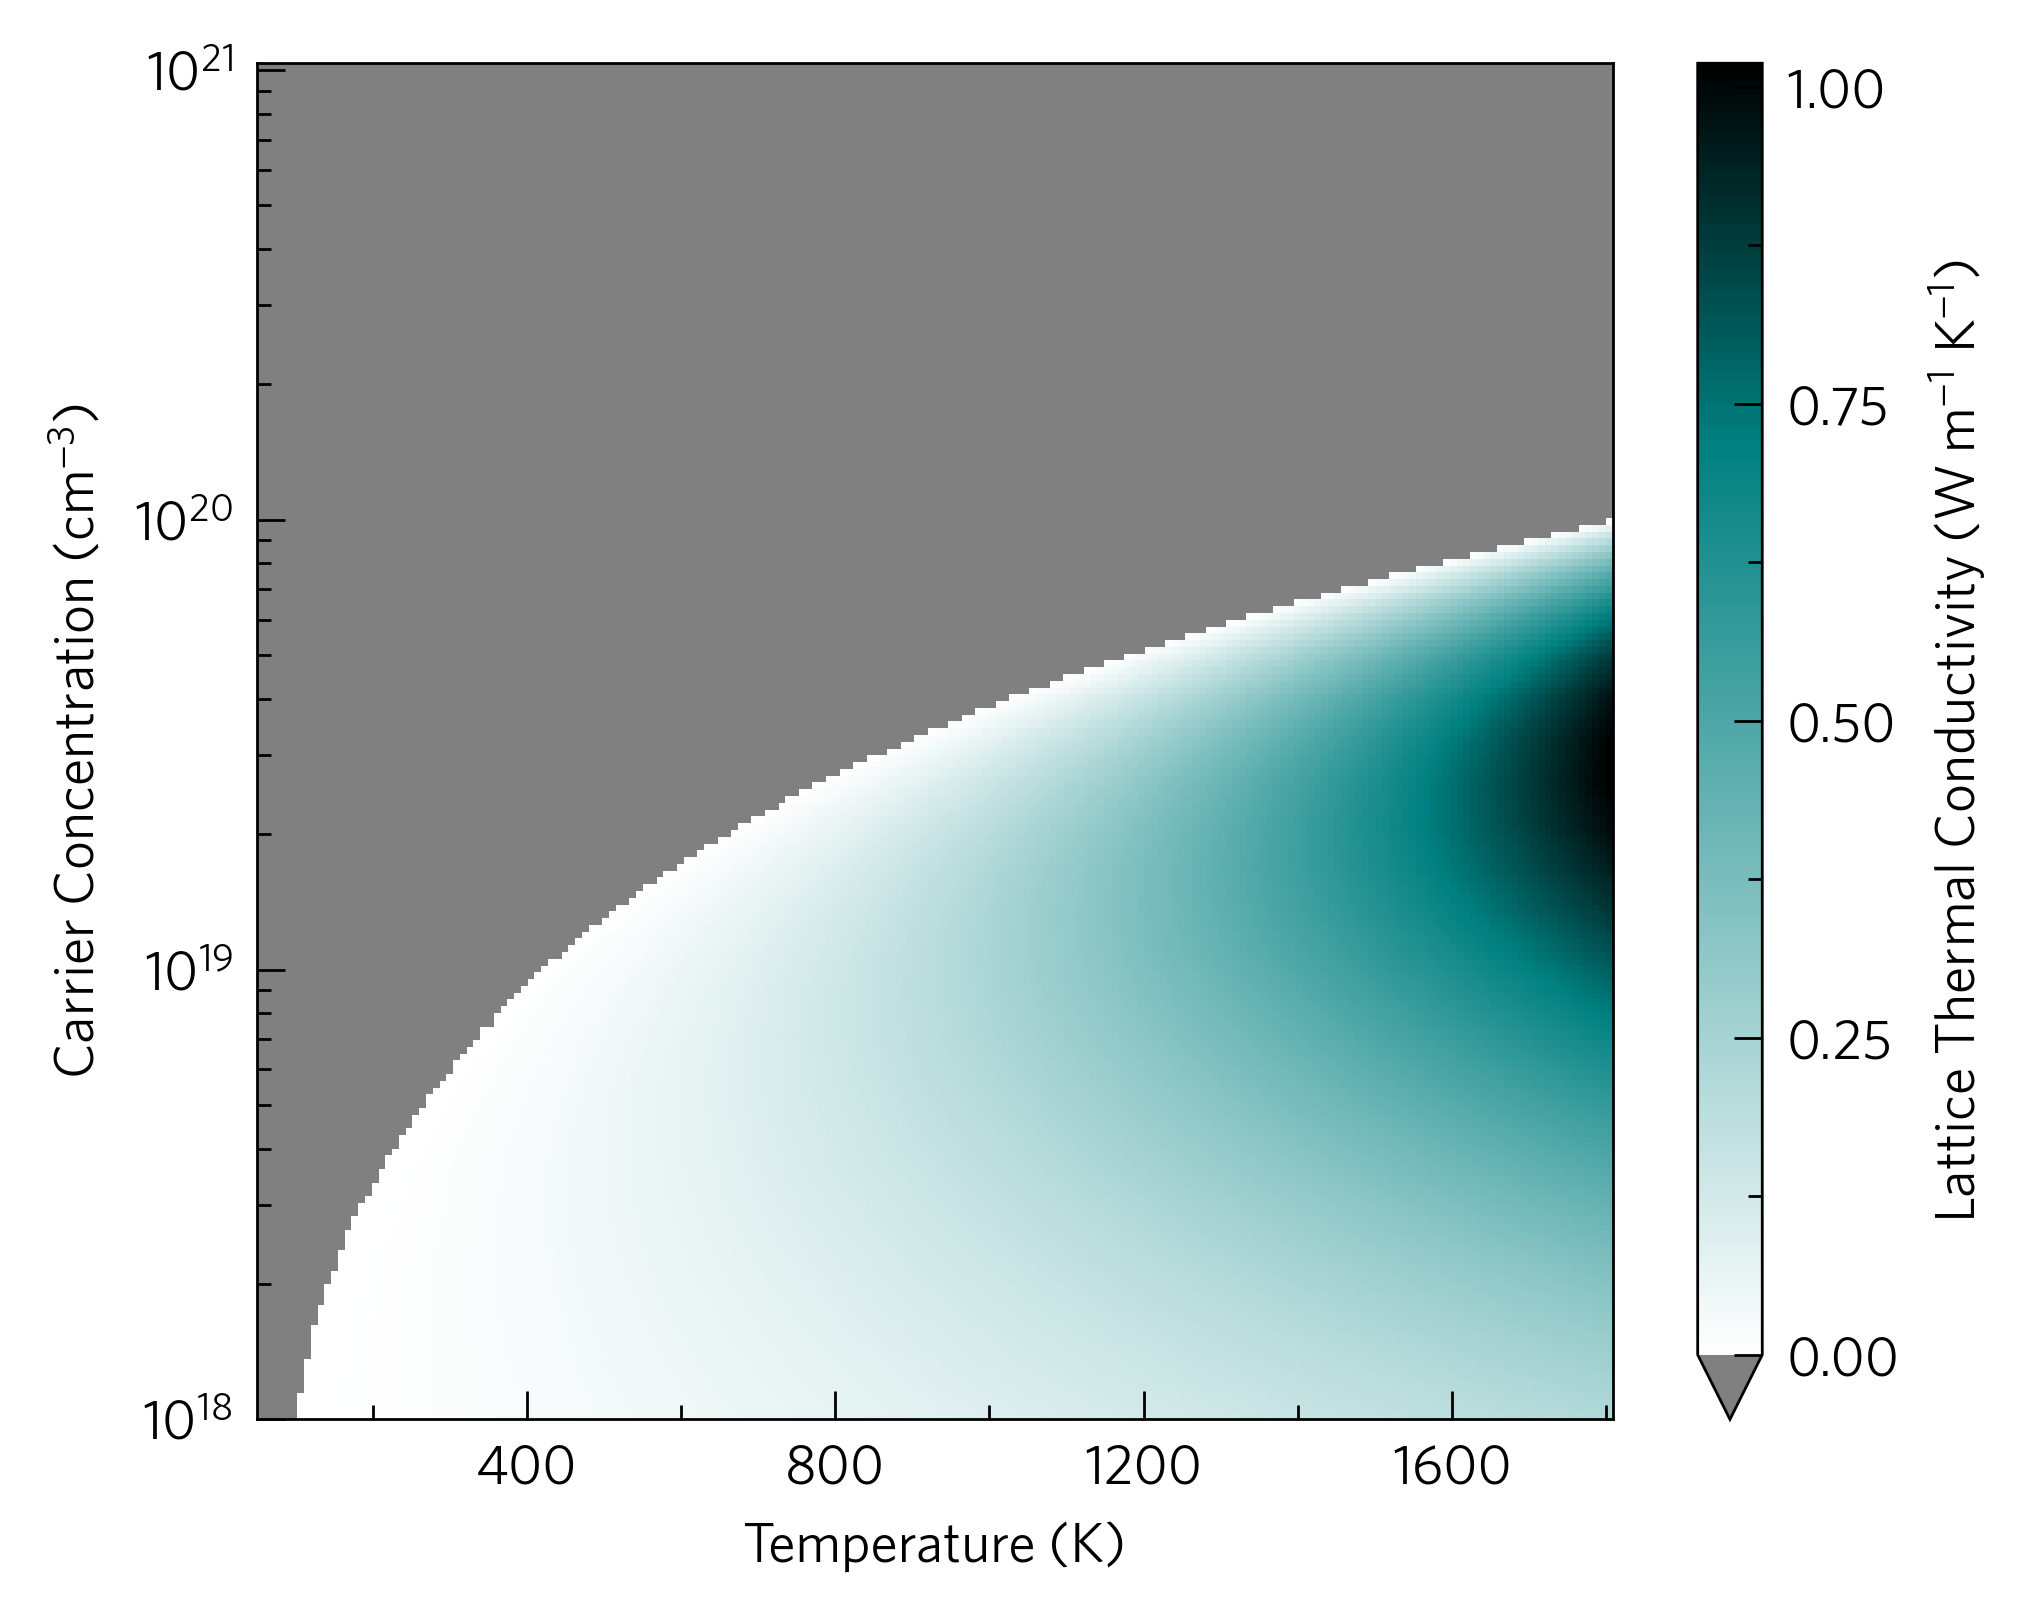
tp plot kappa-target ../data/zno/boltztrap.hdf5 -c '#008080' -d x
Or on the analytical end of the process, zdiff and pfdiff allow
comparison among different datasets.
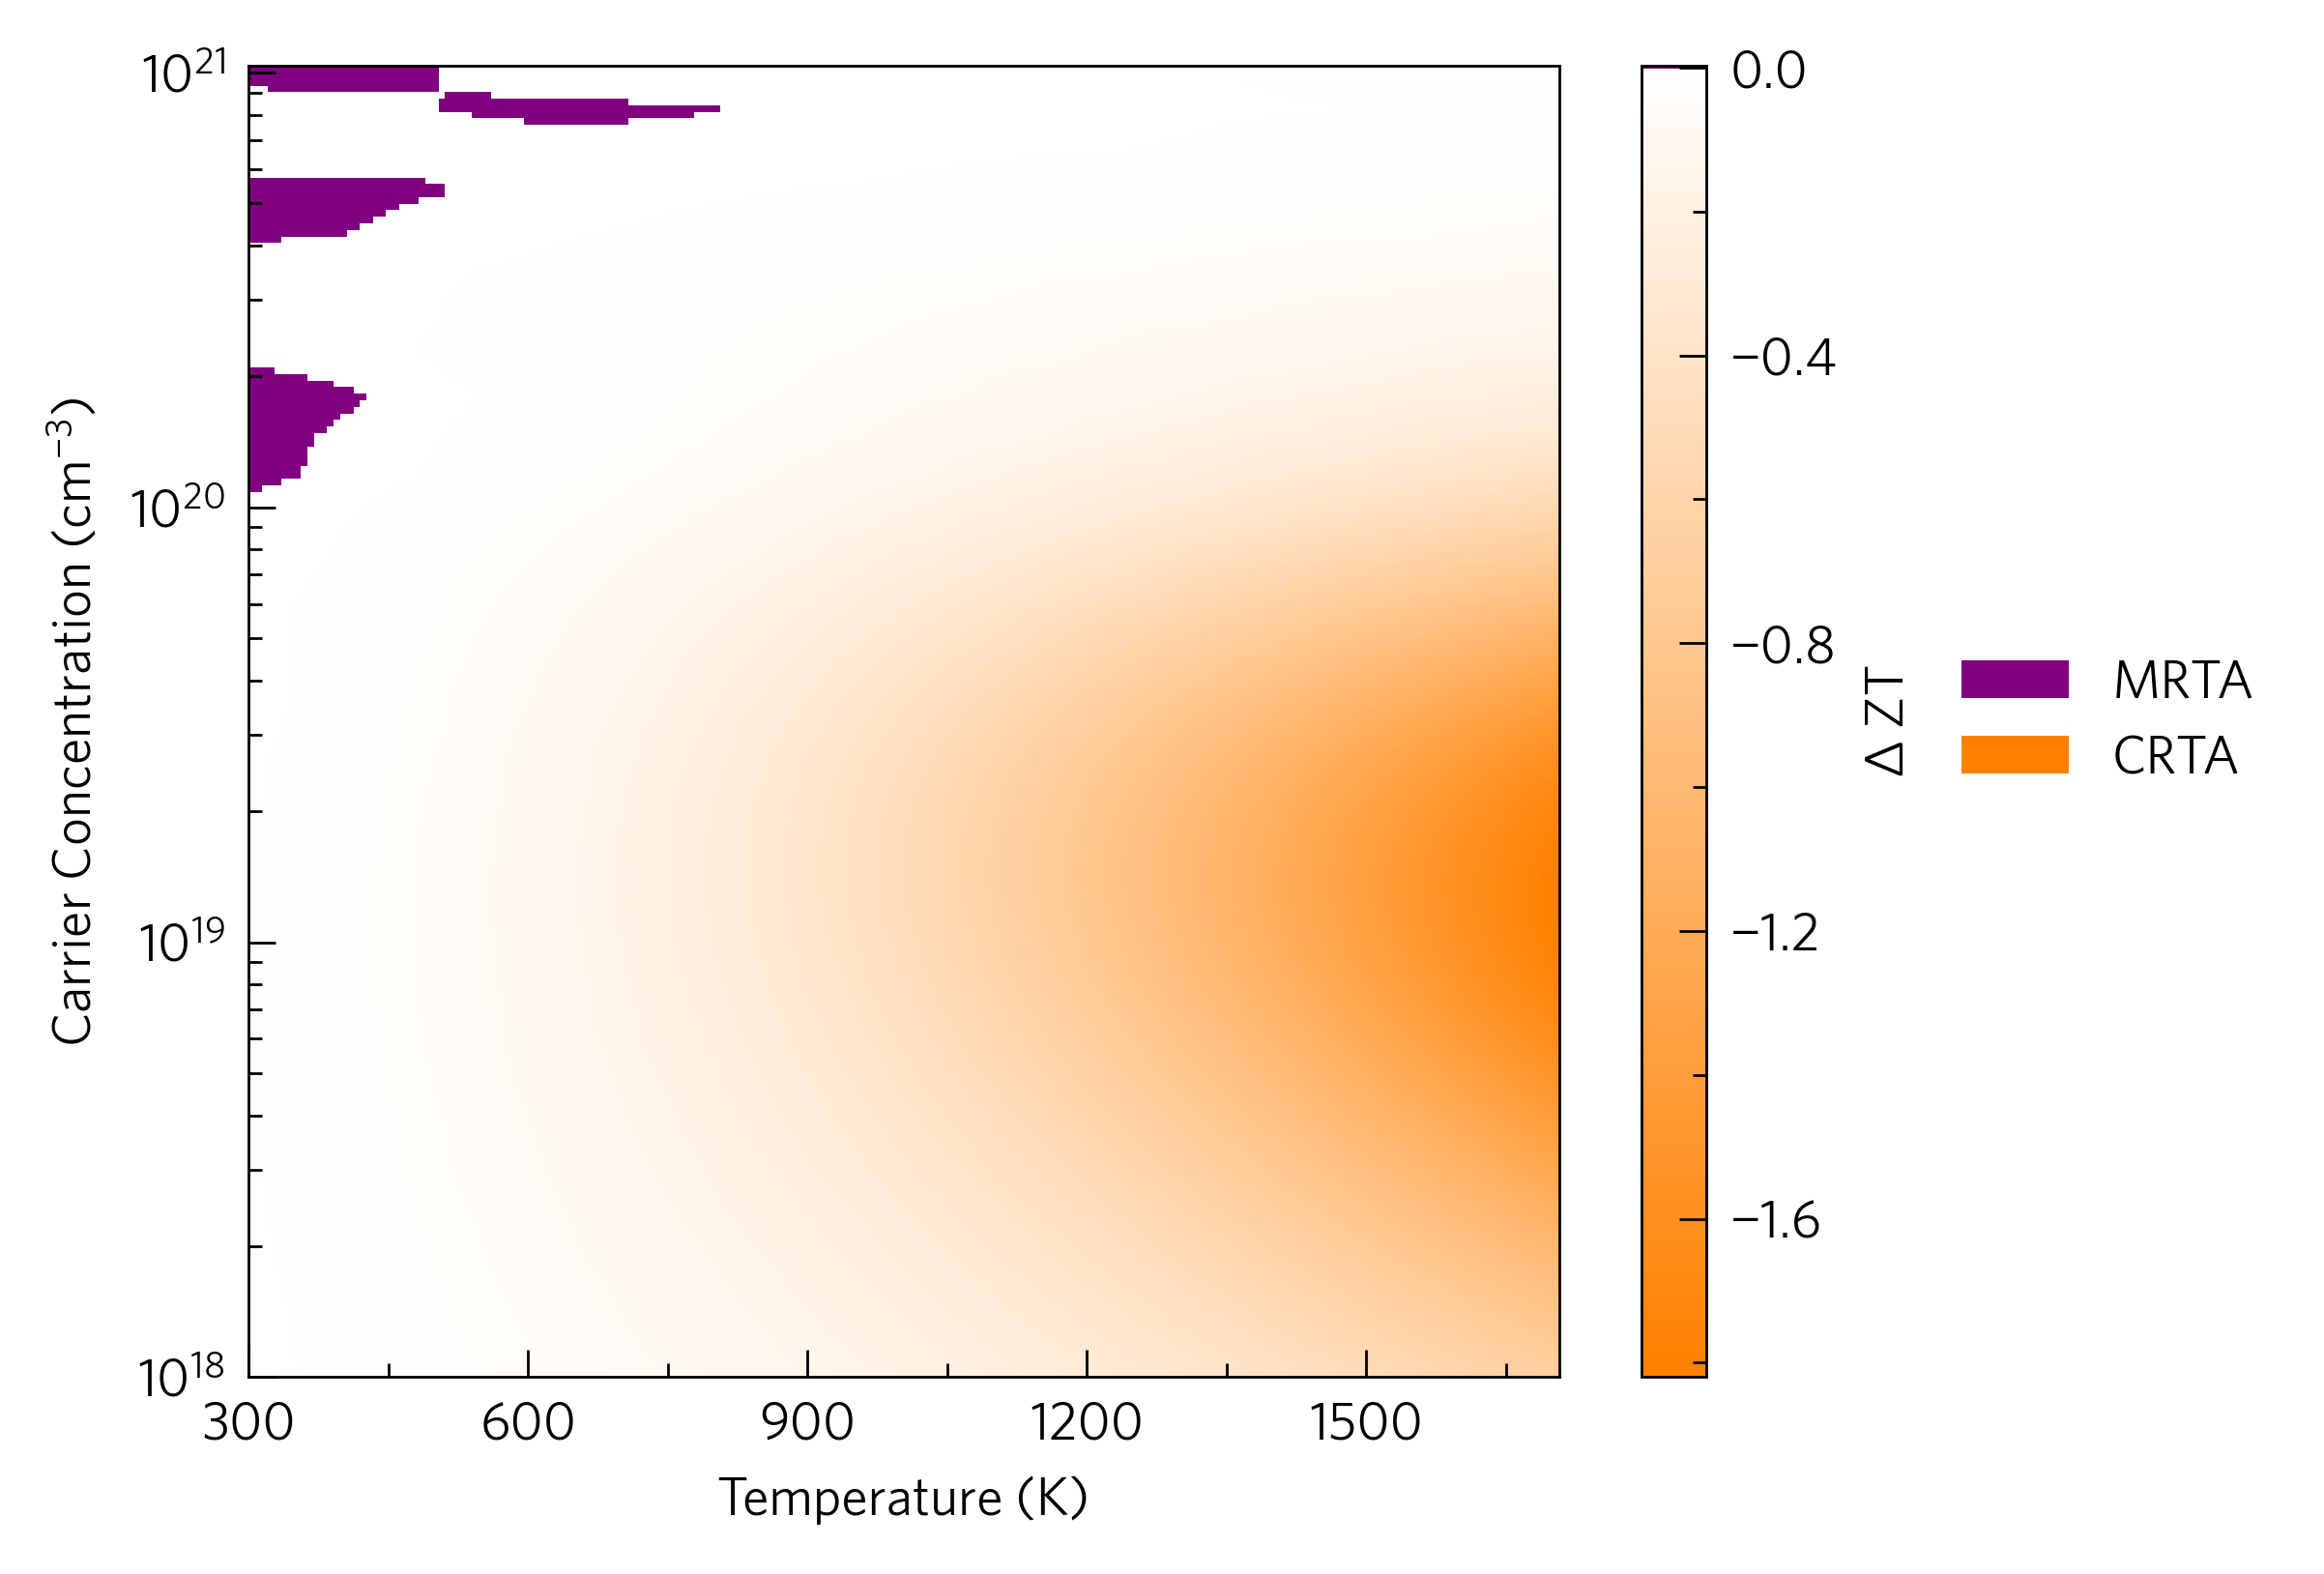
tp plot ztdiff ../data/basno3/transport_75x75x75.json ../data/basno3/boltztrap.hdf5 -k ../data/basno3/kappa-m363636.hdf5 ../data/basno3/kappa-m363636.hdf5 -l{MRTA,CRTA}
Slightly more complex plots also with command line scripts are the phonon dispersions, which can be overlayed and plotted with DoSs.
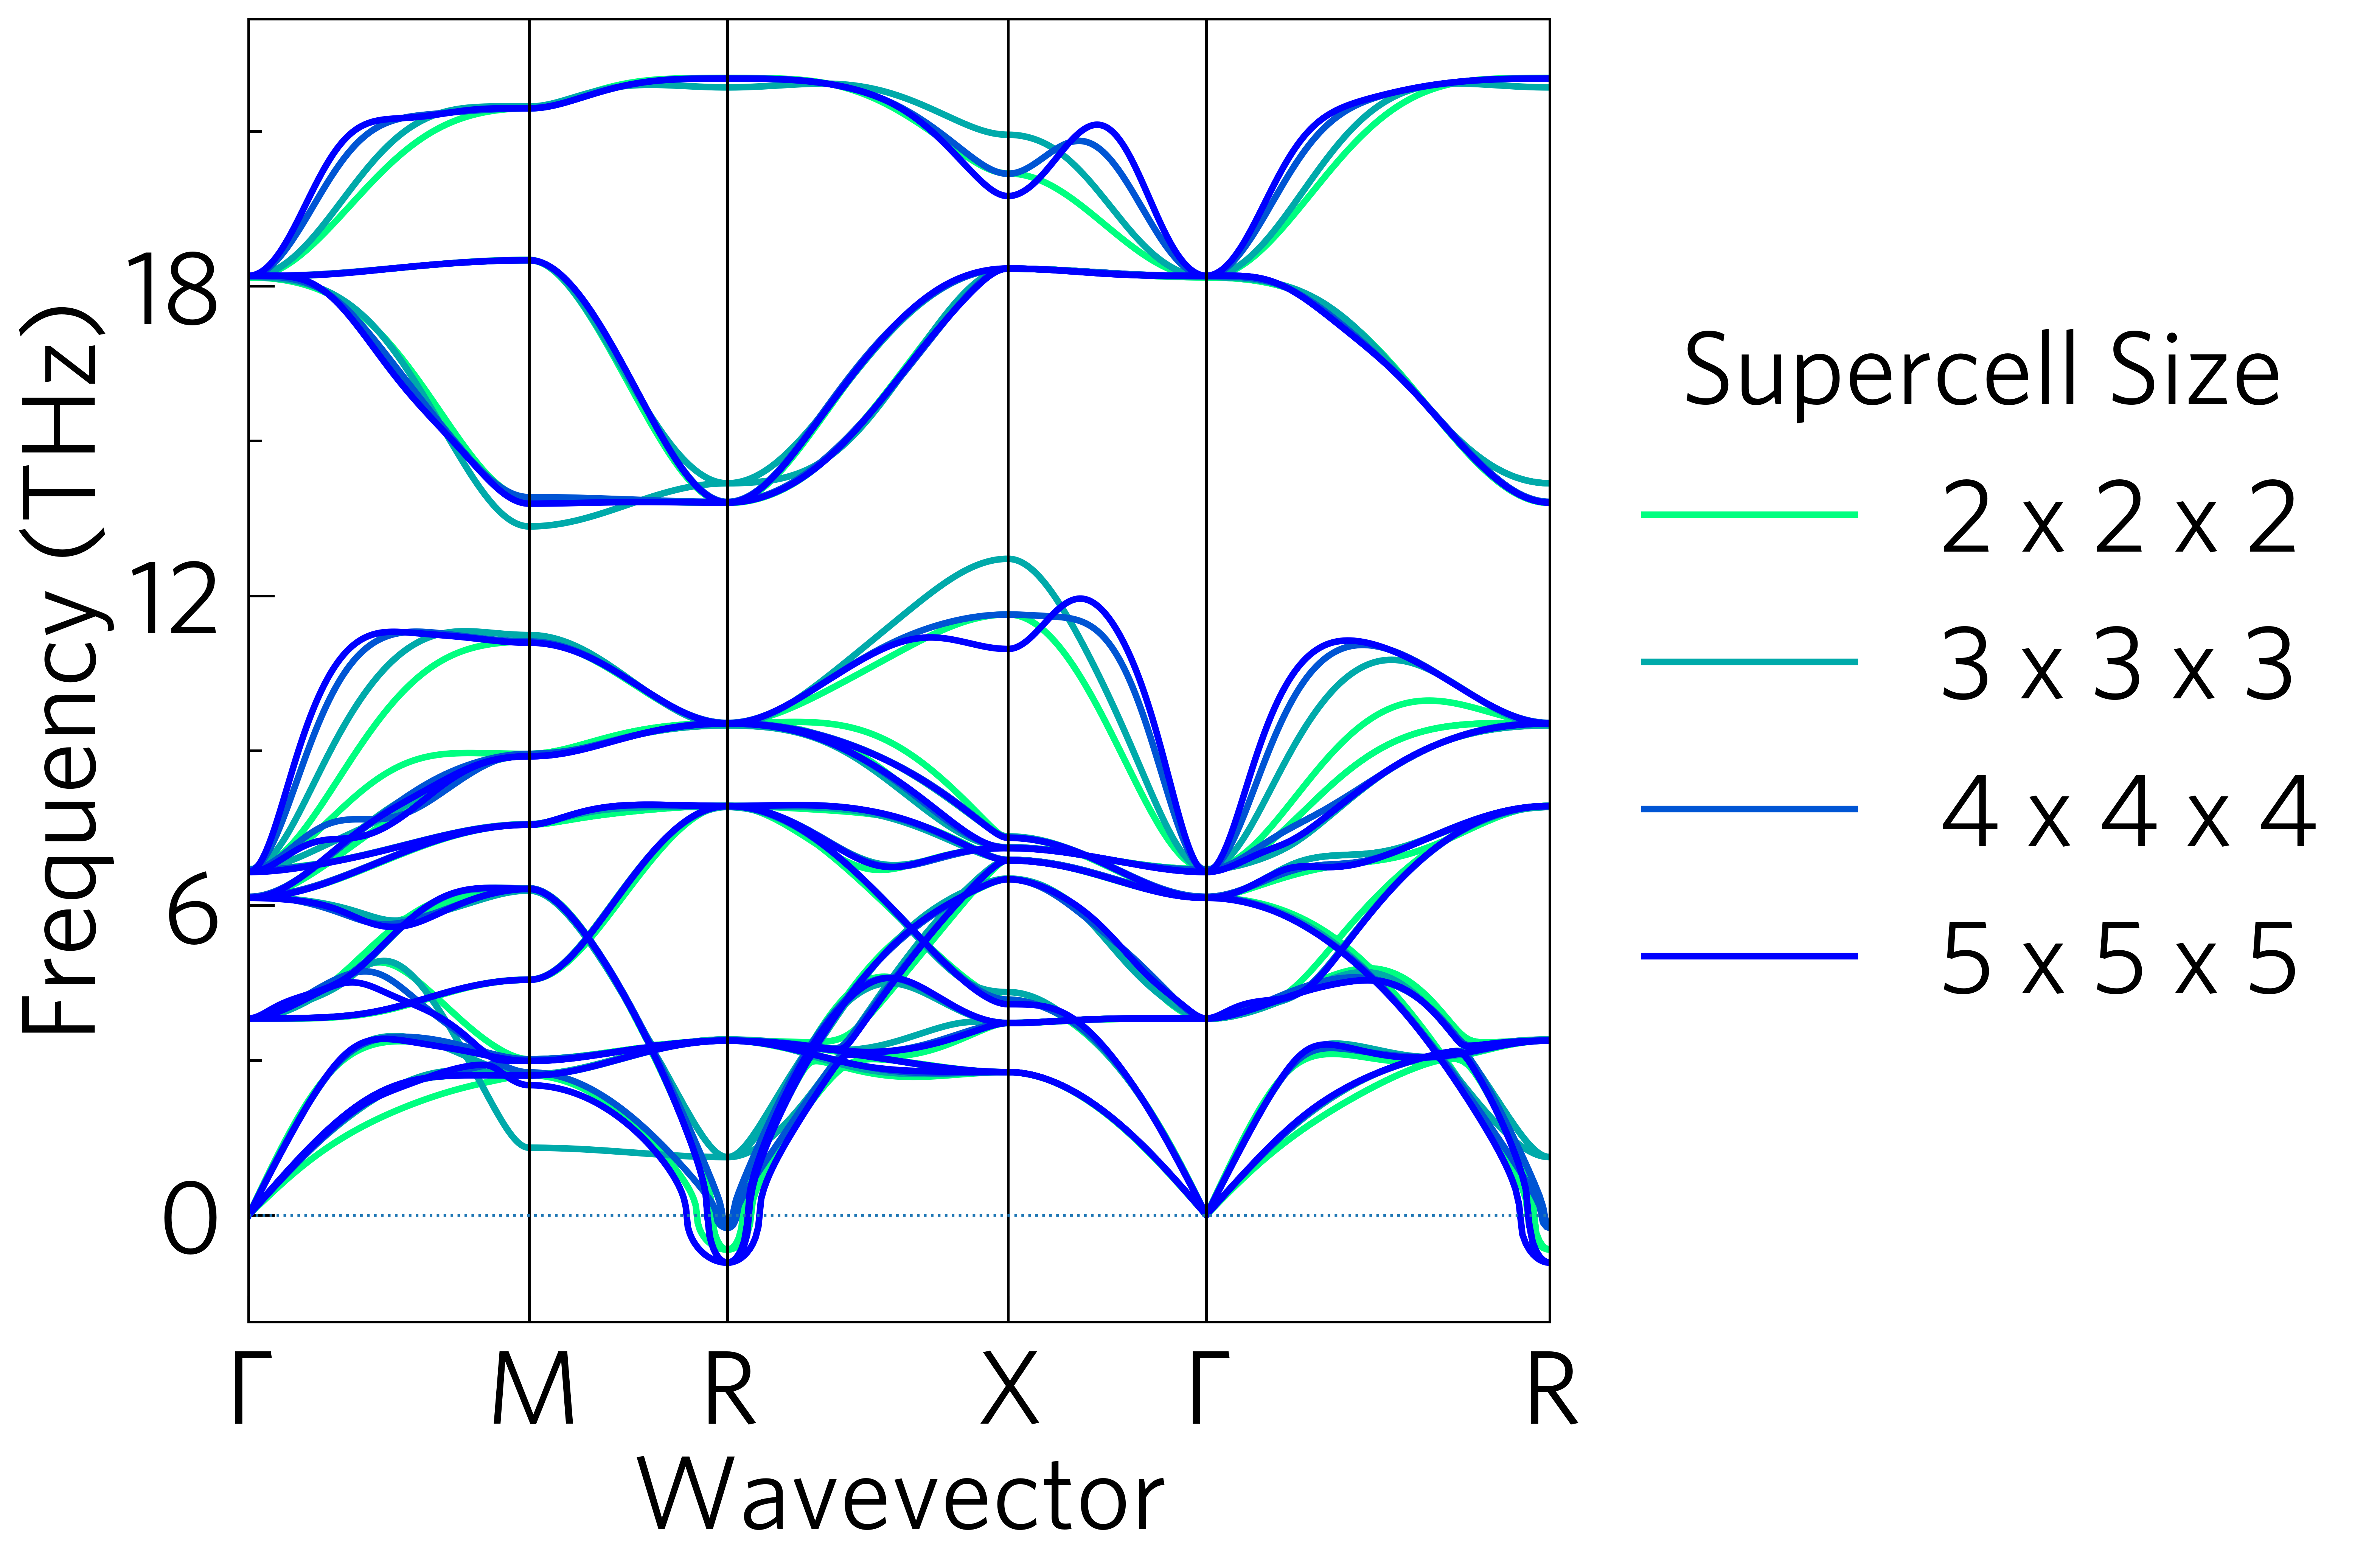
tp plot phonons ../data/basno3/band-*.yaml --legend_title "Supercell Size" -l{"2 x 2 x 2","3 x 3 x 3","4 x 4 x 4","5 x 5 x 5"}
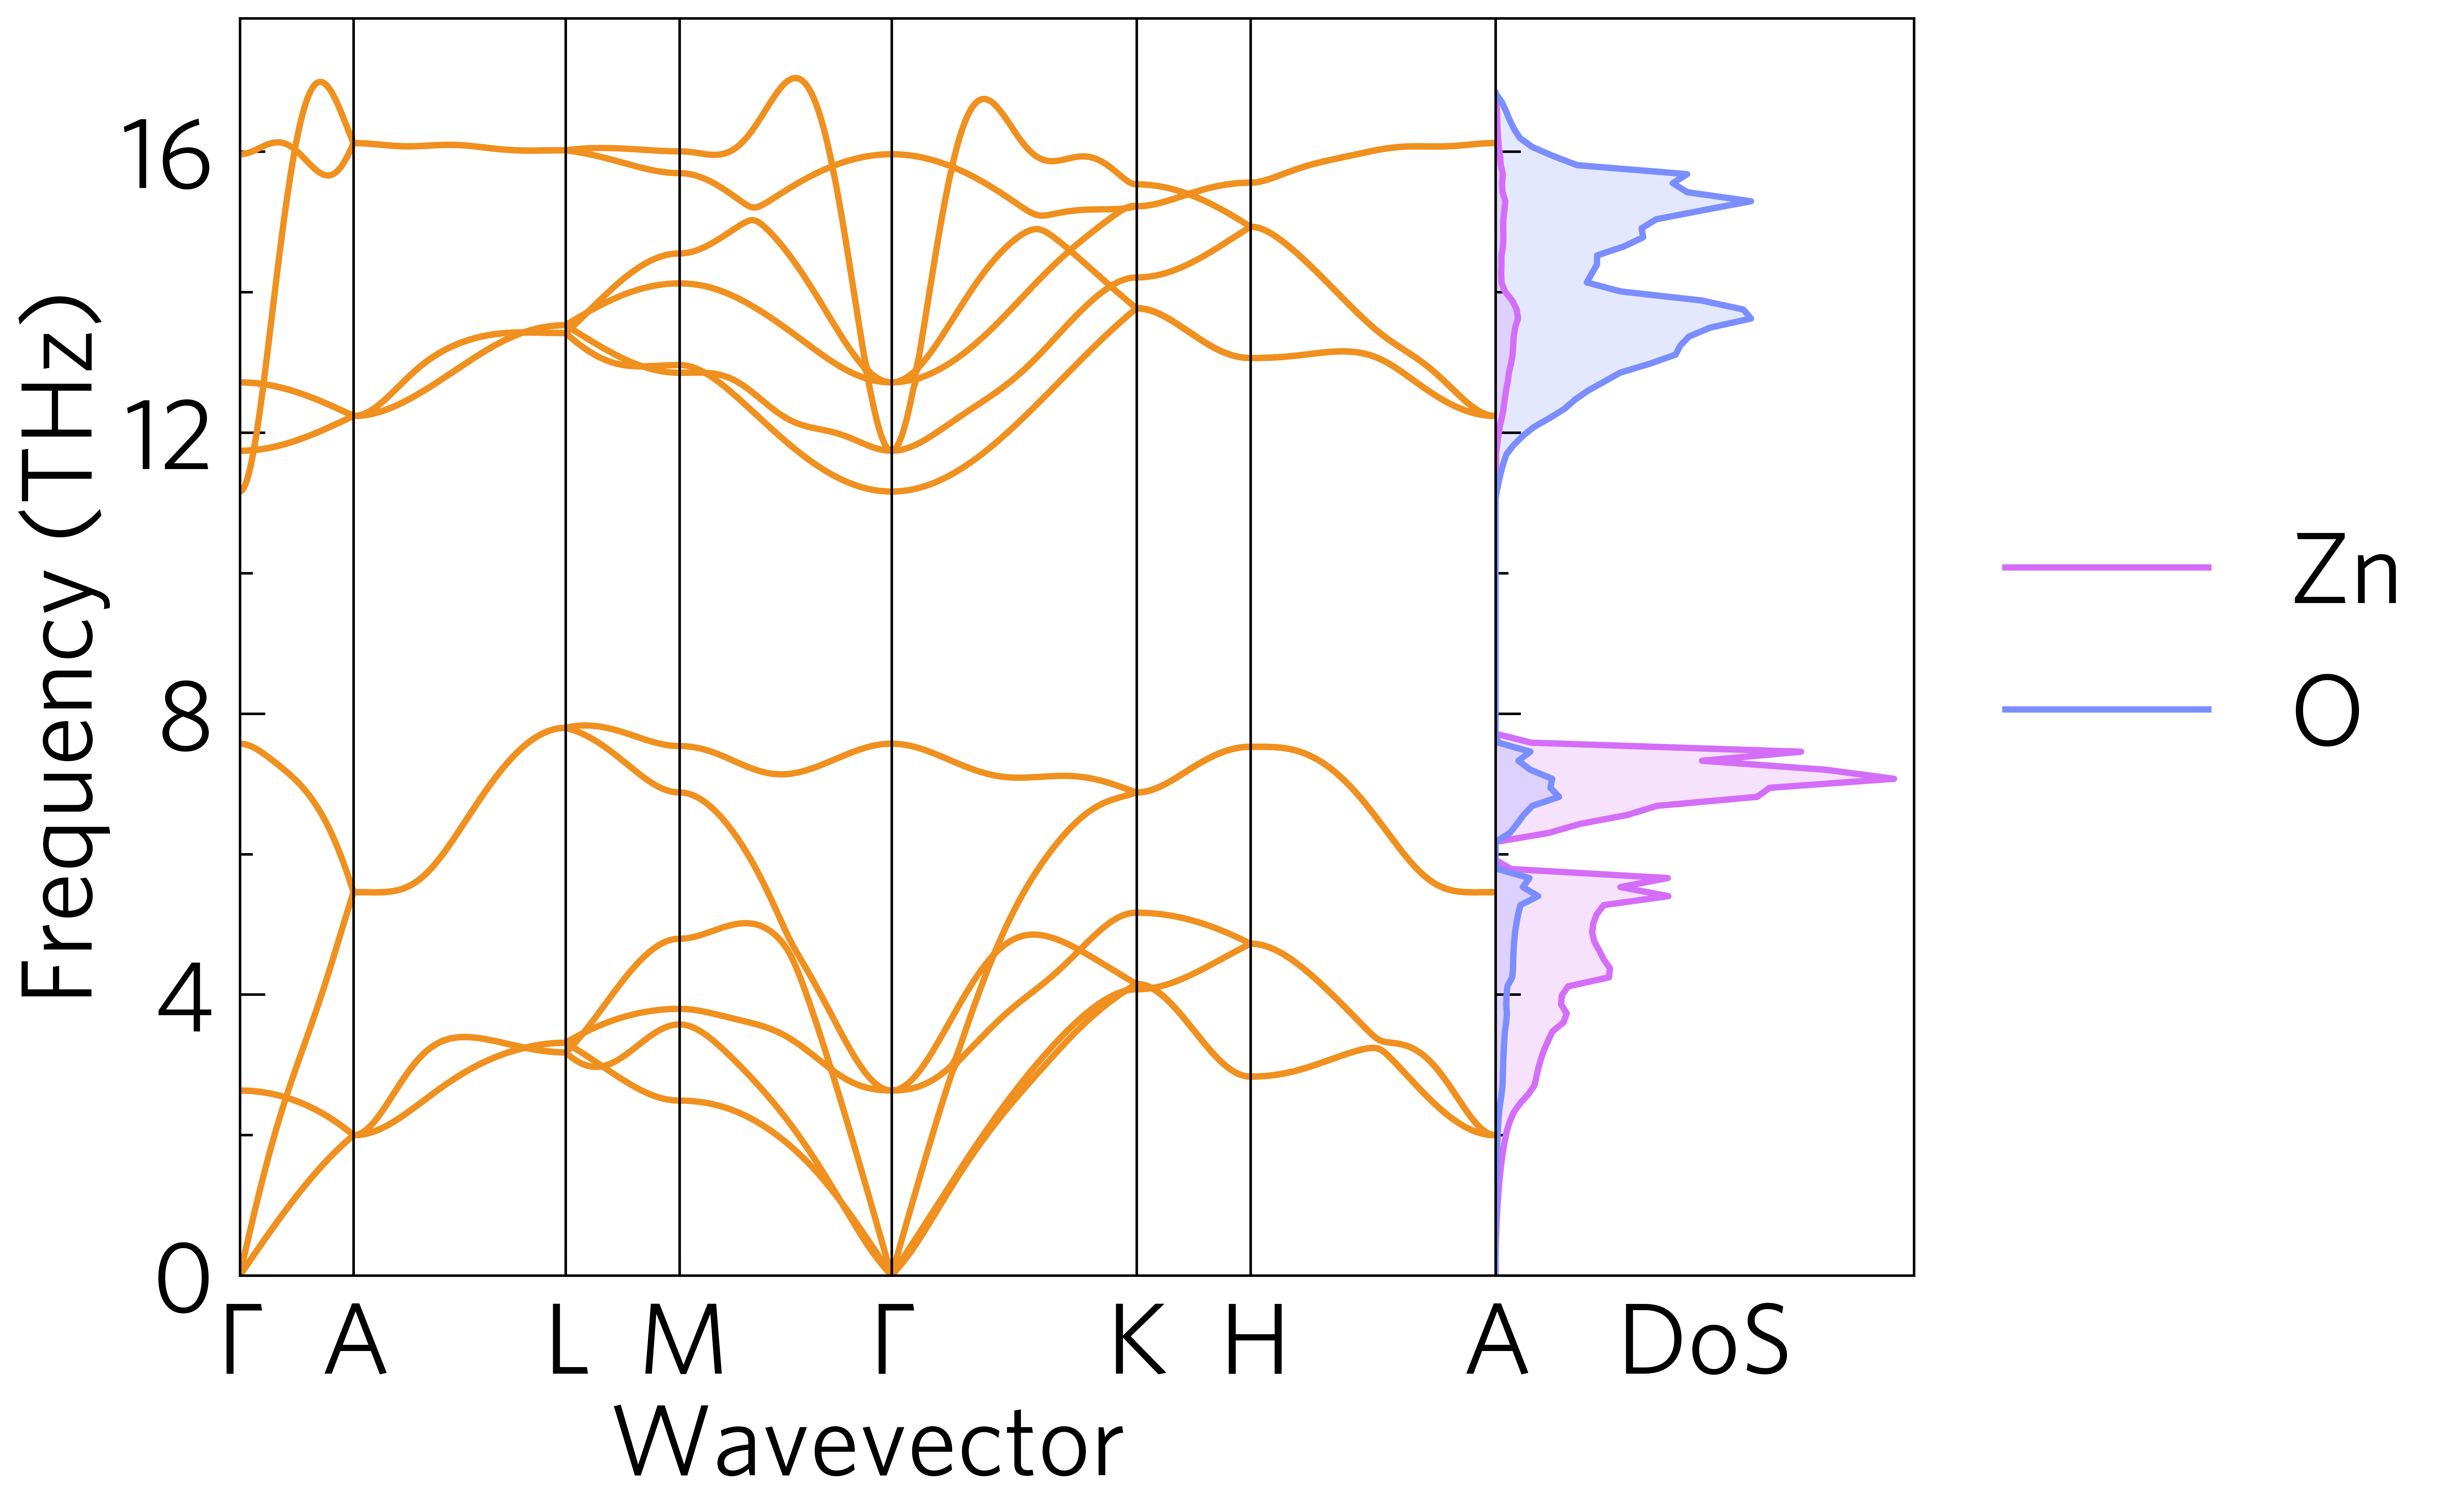
tp plot phonons ../data/zno/band.yaml --dos ../data/zno/projected_dos.dat --poscar ../data/zno/POSCAR --doscolour={'#d46ef9','#7b8eff'} -c '#f0901f'
This is where some of the more useful functions of ThermoParser
come in, e.g. the rescaling of the x axis in the former plot, and the
simplicity of compound axes in the latter. Another example is the ability to
add gaussian smearing to a DoS plot during plotting, removing the need to rerun
e.g. Phonopy or maintain multiple data files.
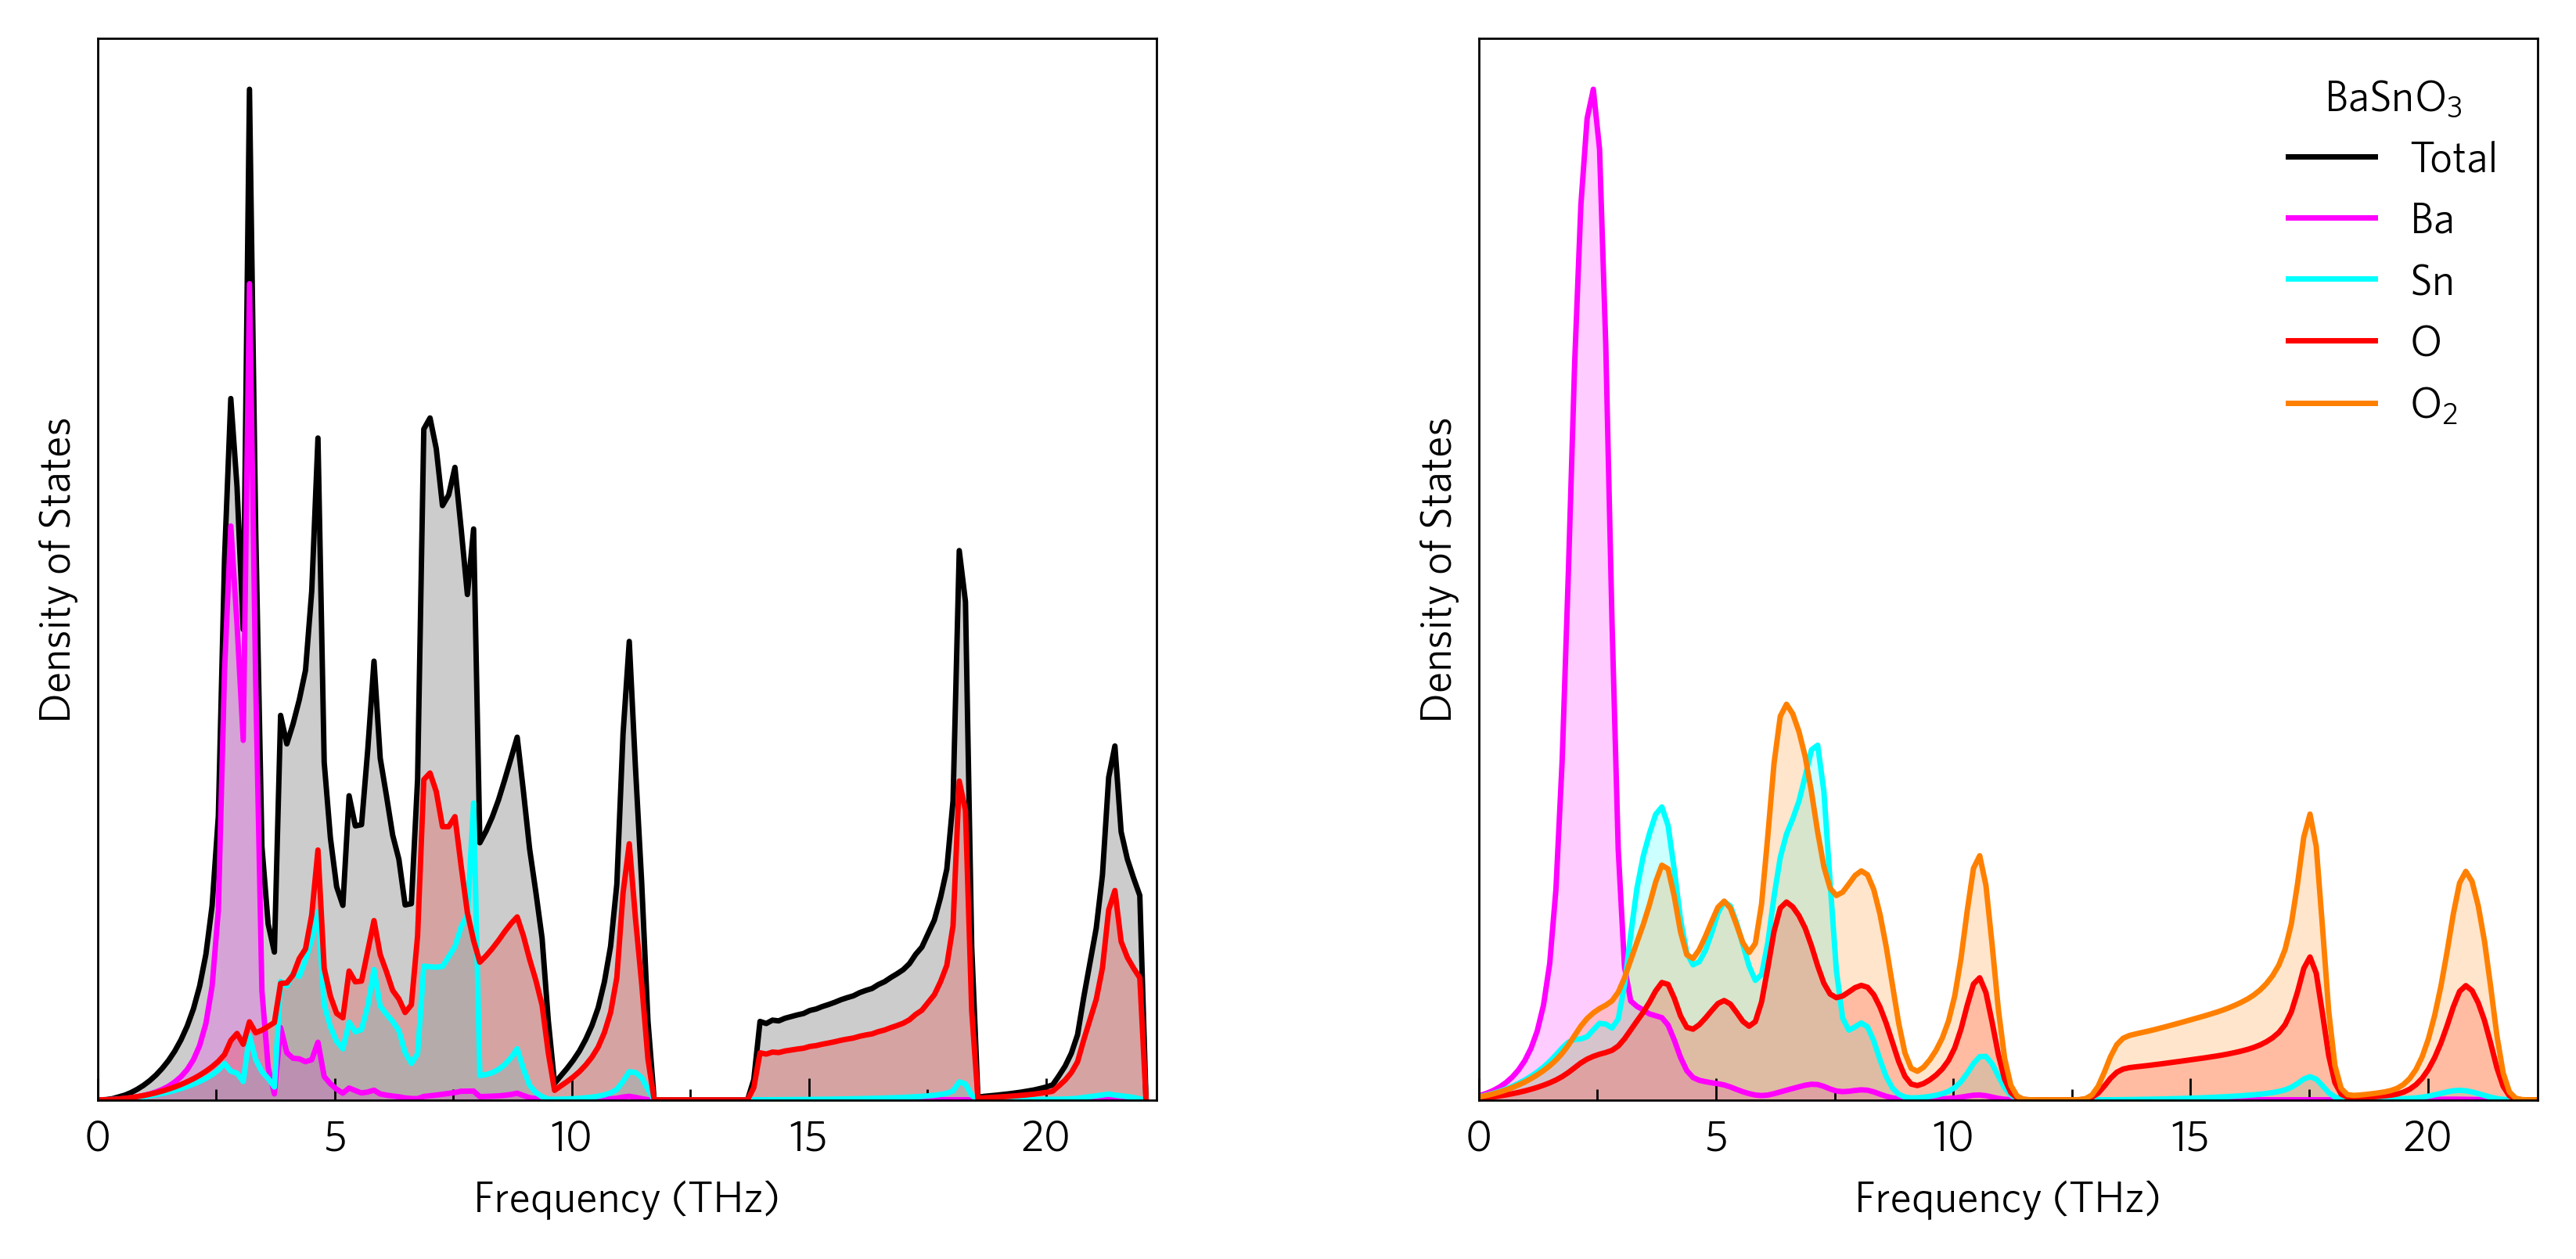
The left-hand plot can be plotted with:
tp plot dos ../data/basno3/projected_dos.dat --total --nolegend -c{pink,cyan,red} -p ../data/basno3/POSCAR
And the right-hand plot can be plotted with:
tp plot dos ../data/basno3/projected_dos.dat --atoms "Ba Sn O O_2 2" --sigma 0.2 --location 1 -c{magenta,cyan,red,orange}
There are command-line scripts, but the main functionality is intended as a python package, which enables much more customisable plotting, to enable nicely formatted multi-axes plots…
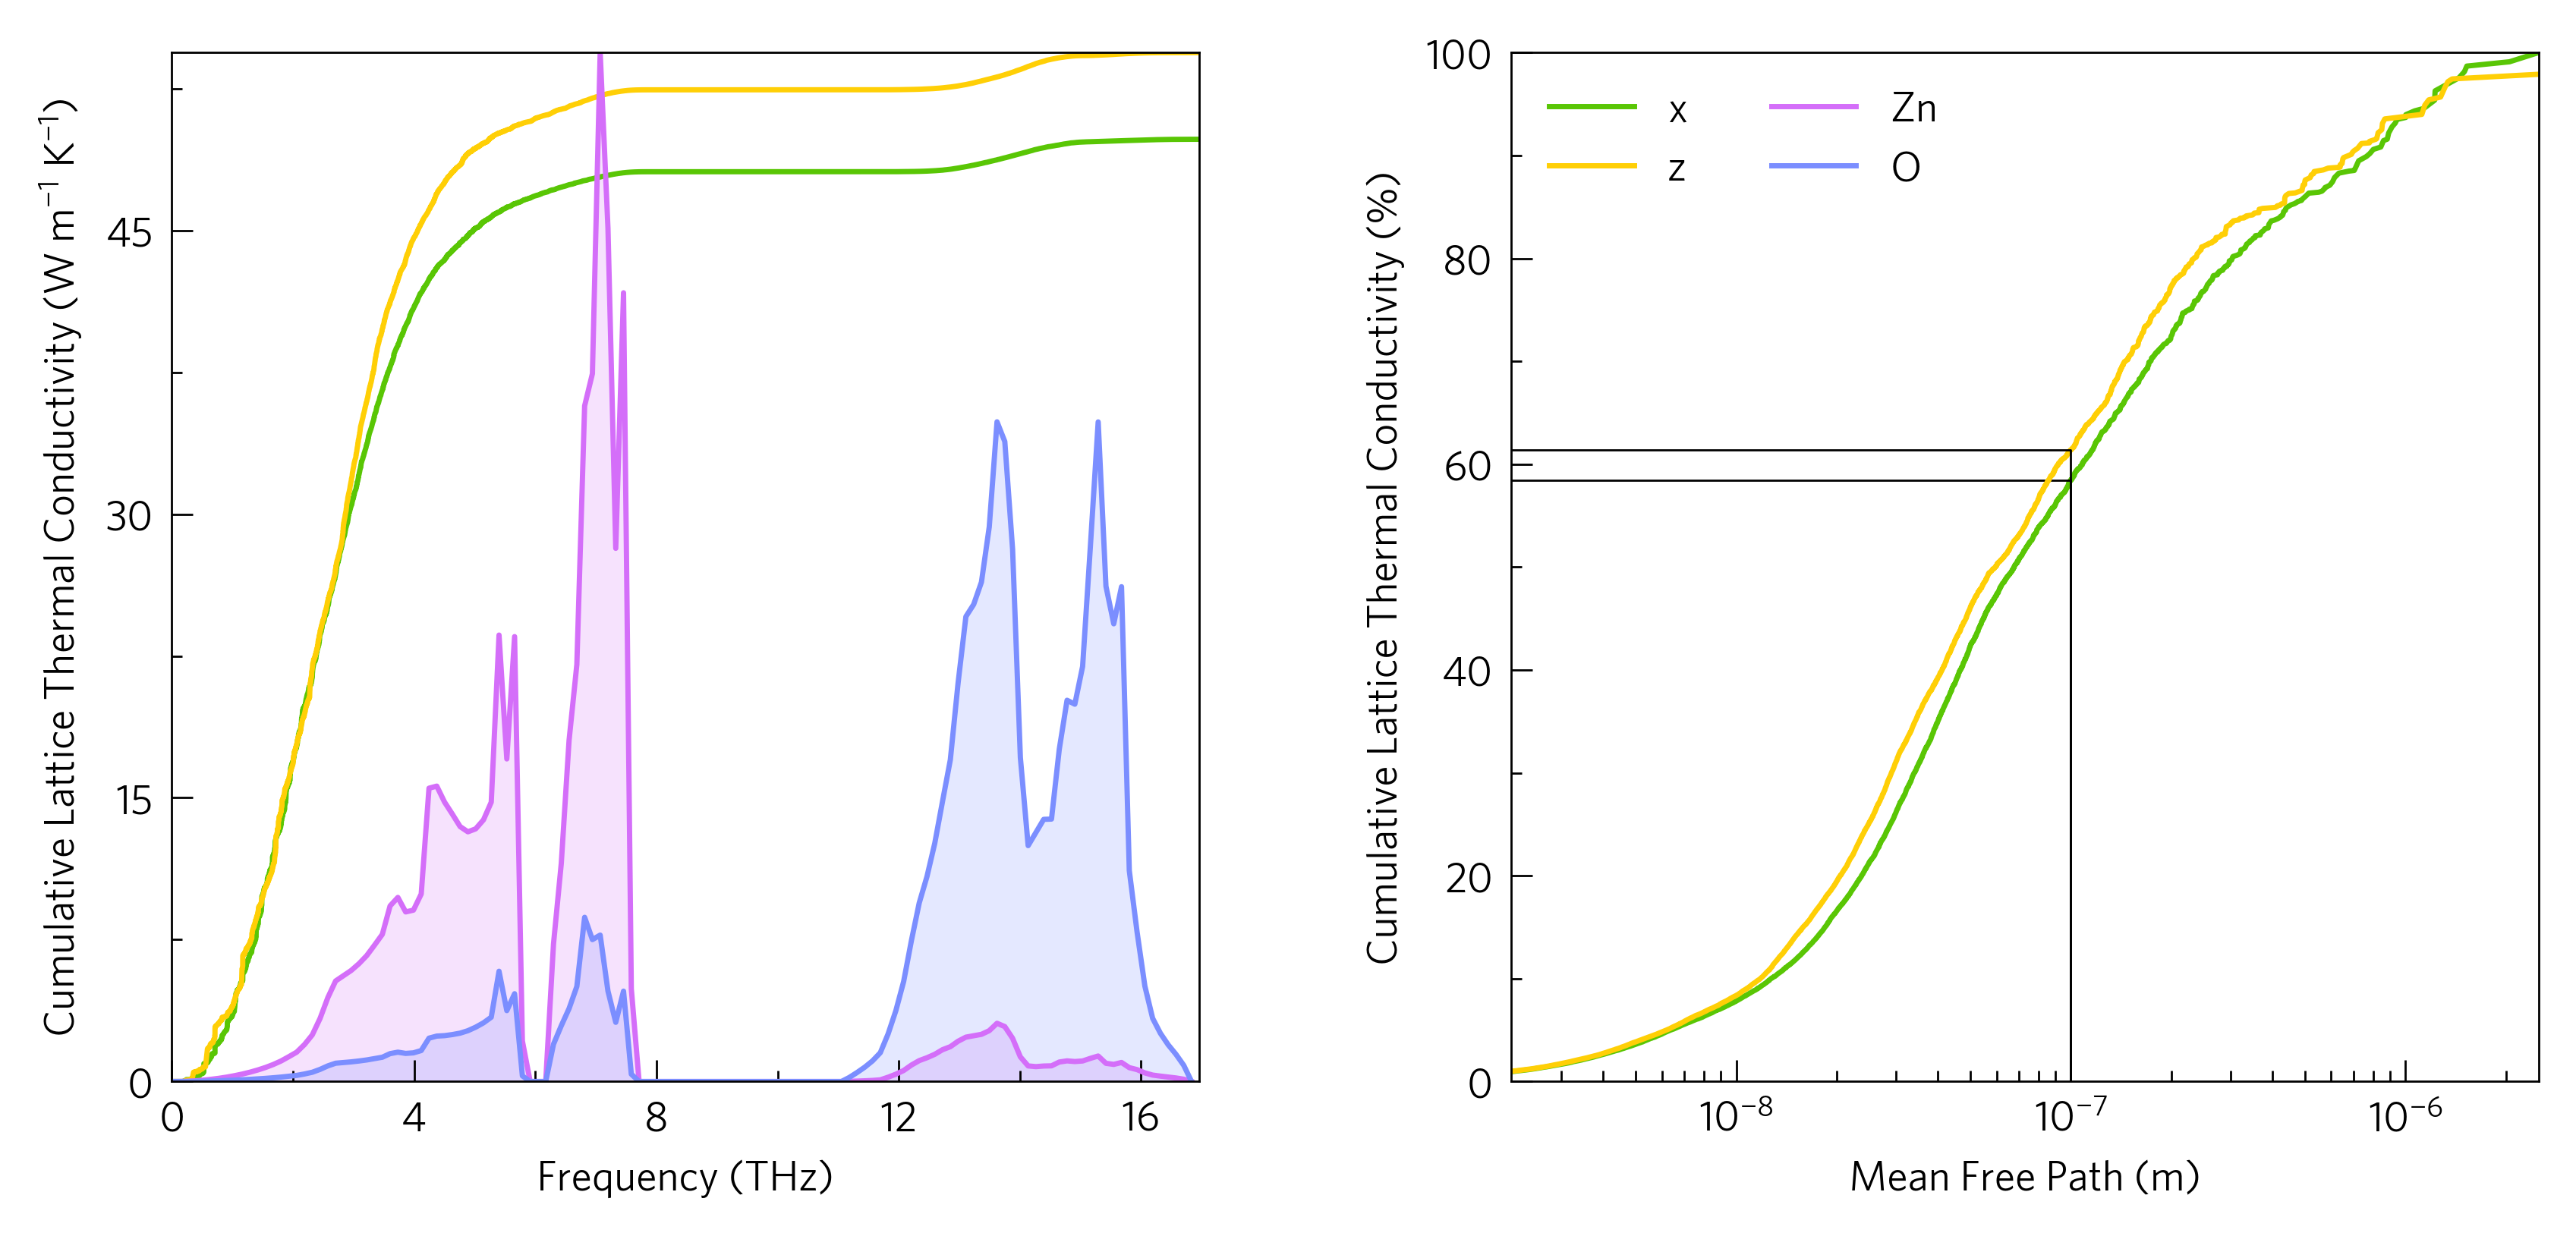
...and multi-plot axes, to highlight particular interactions.
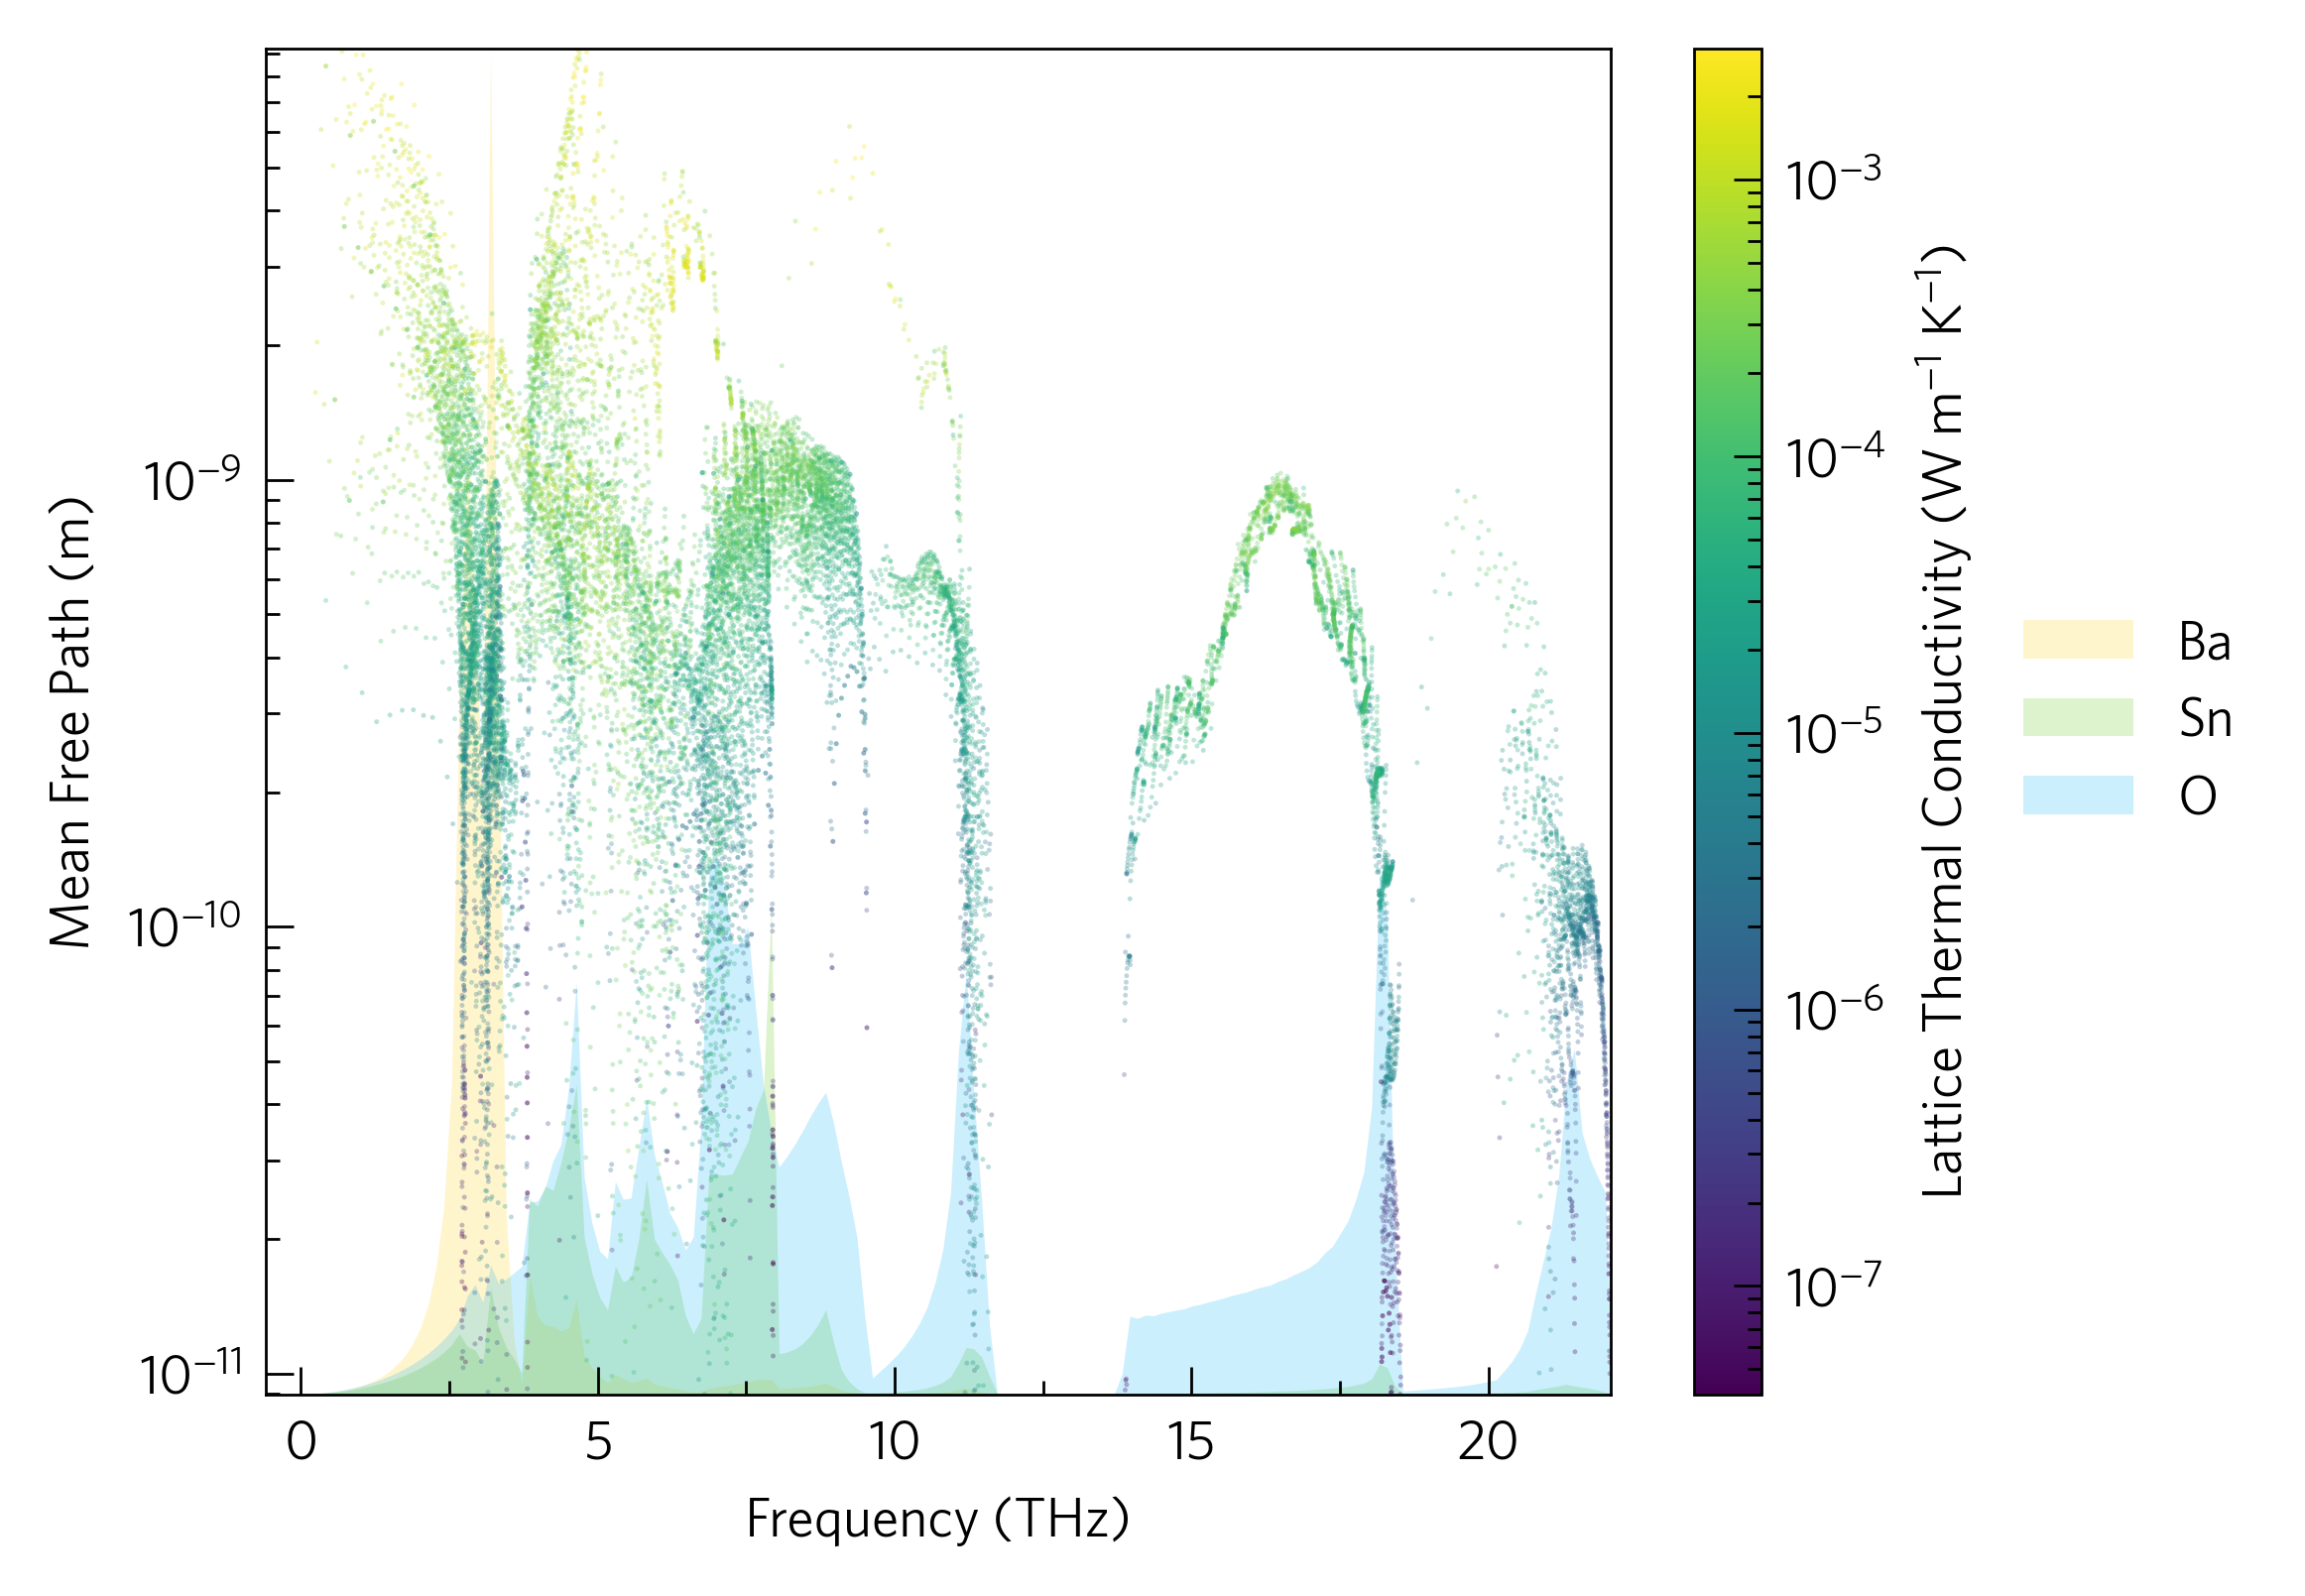
As well as projecting third-order phonon properties onto each other as above, so below we see there are also a number of functions for projecting these properties onto phonon dispersions. The former is an oft plotted widening of the bands due to scattering,2 and the latter shows the same data, but in a more quantitative way.
tp plot wideband ../data/zno/band.yaml ../data/zno/kappa-m404021.hdf5 -c{black,red} -s dark_background -p ../data/zno/POSCAR
Besides plotting, ThermoParser offers a number of ways to streamline
transport property workflows, from generating more efficent input files
(tp gen), to data consolidation (tp.utilities.merge) and
retrieval (tp.utilities.resolve and tp get), to pre-typed axis labels,
because thats long… many of these outlined in the tutorials, and some are
demonstrated in this line plot, which is not available as a python command,
but is easily scripted or plotted at the command line:
tp plot avg-rates ../data/basno3/mesh_75x75x75.h5 -t 1000 -n -1e19 --location 2 --large -c{red,blue,magenta}
It shows the k-point and Fermi-Dirac weighted scattering rates against temperature and carrier concentration, to give an accurate picture of their effect on the electrical conductivity. This can also be done for the electron mean free paths.
There are also a number of cosmetic options in the python interface, which may be of interest outside the main scope of ThermoParser, e.g. the custom colourmaps, legend formatting tools and axes labels.
Reference
[1] K. B. Spooner, A. M. Ganose and D. O. Scanlon, J. Mater. Chem. A, 2020, 8, 11948. [2] A. A. Maradudin and A. E. Fein, Phys. Rev., 1962, 128, 2589.