sumo-phonon-bandplot
sumo-phonon-bandplot is a program for generating publication-ready phonon band
structure diagrams based on phonopy calculations.
Usage
The full range of options supported by sumo-phonon-bandplot are detailed in the
Command-Line Interface section, and be can be accessed using the command:
sumo-phonon-bandplot -h
To plot a phonon band structure, simply run the following command in a folder
containing FORCE_SETS and SPOSCAR files generated by phonopy and a VASP POSCAR:
sumo-phonon-bandplot
The plot will be written to a file named phonon_band.pdf, with the raw band structure
data written to phonon_band.dat and a yaml formatted band structure written to phonon_band.yaml
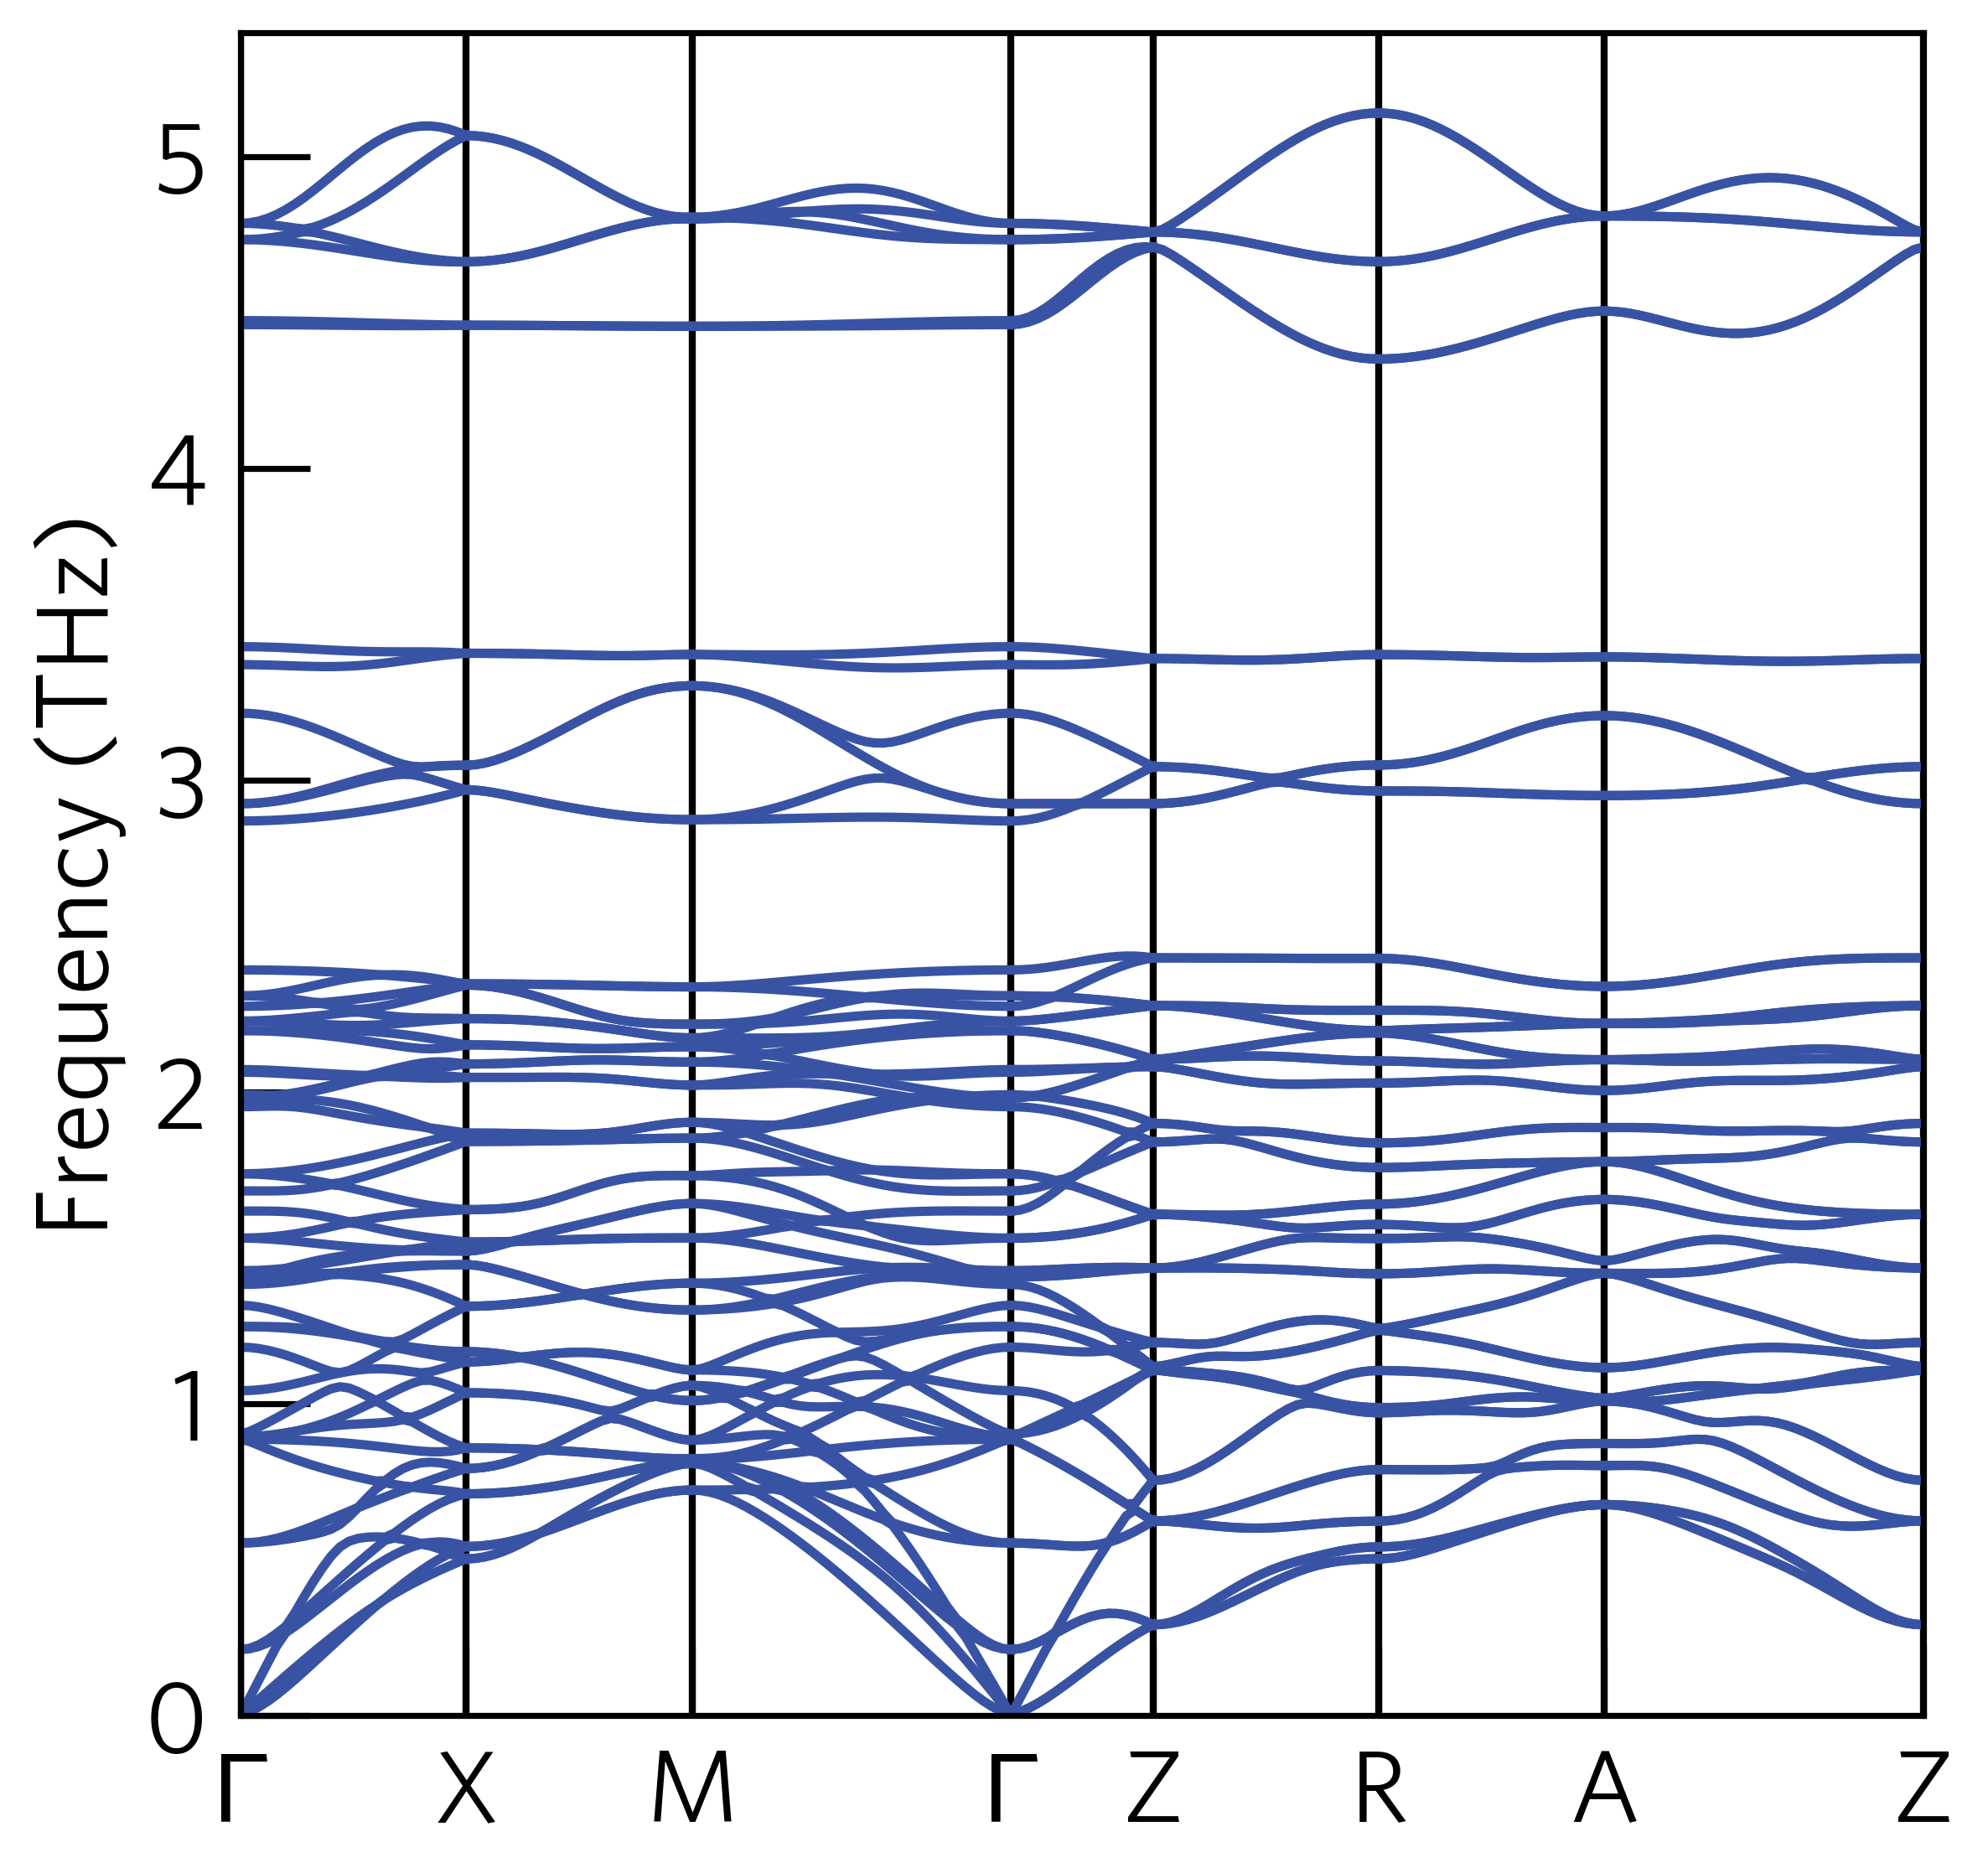
For example, if we run the command in the sumo/tests/data/Rb2SnI6/phonopy directory, the band structure
should look like:
Supercell Size
sumo-phonon-bandplot will attempt to extract the supercell size from the structure information, however,
sometimes it will fail and an error occurs. In this case, the supercell size should be specified manually using
the --dim option. For example, if the force constants were calculated in a 3x3x3 supercell, the
command would be:
sumo-phonon-bandplot --dim 3 3 3
Supported Inputs
sumo-phonon-bandplot will automatically look for a FORCE_SETS file in the current directory,
however, other input types are supported. The input can be specified using the --filename option.
The supported inputs are:
FORCE_SETS: If--dimnot specified,POSCARandSPOSCARfiles should also be in the current directory.FORCE_CONSTANTS: In this case, a correspondingPOSCARandSPOSCARare not required.band.yaml:phonopy-type band structure yaml file. Please note that when using this mode, the high-symmetry path cannot be altered.
Basic Options
The height, and width of the graphic, along with the y-axis limits, can be controlled via the
--width, --height, --ymax, and --ymin options.
By default, the eigenvectors are not written to the phonon_band.yaml file.
To enable writing of the eigenvectors use the --eigenvectors option.
The Born effective charges can be included, in order to calculate the LO-TO splitting.
The usage is --born BORN_FILE, where BORN_FILE is a file containing the Born effective
charges. The easiest way to generate this file is using the phonopy-vasp-born script,
included in the phonopy installation.
If the force constant calculations have been performed on the conventional cell,
the --primitive-axis option can be used to unfold the band structure onto the
primitive cell. The input for this option should be formatted as a list of 9 numbers, specifying
the full matrix transformation. For example, to convert from the F centered cubic conventional
cell to primitive cell, the usage would be:
sumo-phonon-bandplot --primitive-axis 0 0.5 0.5 0.5 0 0.5 0.5 0.5 0
High-Symmetry k-Point Path
By default, the paths used are those from Bradley and Cracknell [brad]. To use the k-point paths provided
SeeK-path [seek] or pymatgen [curt]. The options --seekpath or --pymatgen can be used.
sumo-phonon-bandplot also supports generating k-points along custom k-point paths.
This is controlled using the --kpoints option. The custom k-point path is specified
as a string with commas separating the k-points.
For example, to plot the band structure along 0. 0. 0. -> 0.5 0.5 0.5, the usage is:
sumo-phonon-bandplot --kpoints "0 0 0, 0.5 0.5 0.5"
Breaks in the band structure can be indicated using the pipe character.
For example, the path 0. 0. 0. -> 0.5 0.5 0.5 | 0. 0. 0. -> 0.5 0. 0., is specified as:
sumo-phonon-bandplot --kpoints "0 0 0, 0.5 0.5 0.5 | 0 0 0, 0.5 0 0"
Custom labels can also be provided using the --labels option. The syntax is the same as for the
--kpoints option. For example, the labels for the above path are written as:
sumo-phonon-bandplot --kpoints "0 0 0, 0.5 0.5 0.5 | 0 0 0, 0.5 0 0" \
                      --labels "\Gamma, M | \Gamma, X"
Note: in all cases the arguments are surrounded in parentheses.
Command-Line Interface
phonon-bandplot is a script to produce publication ready phonon band structure diagrams
usage: sumo-phonon-bandplot [-h] [-f F] [-p P] [-d D] [-q N N N] [-b B] [-e]
                            [--dim N [N ...]] [--poscar POS]
                            [--primitive-axis M M M M M M M M M |
                            --primitive-auto] [--symprec SYMPREC]
                            [--units UNITS] [--spg SPG] [--density DENSITY]
                            [--seekpath] [--pymatgen] [--cartesian]
                            [--kpoints KPOINTS] [--labels LABELS]
                            [--height HEIGHT] [--width WIDTH] [--ymin YMIN]
                            [--ymax YMAX] [--style STYLE [STYLE ...]]
                            [--no-base-style] [--config CONFIG]
                            [--format FORMAT] [--dpi DPI] [--font FONT]
                            [--dos [DOS]] [--to-json TO_JSON]
                            [--from-json FROM_JSON [FROM_JSON ...]]
                            [--to-web TO_WEB] [--legend [LEGEND ...]]
Named Arguments
- -f, --filename
FORCE_SETS, FORCE_CONSTANTS or band.yaml file
- -p, --prefix
prefix for the files generated.
- -d, --directory
output directory for files
- -q, --qmesh
q-mesh to use for phonon DOS
Default:
(8, 8, 8)- -b, --born
born effective charge file
- -e, --eigenvectors
write the phonon eigenvectors to yaml file
- --dim
supercell matrix dimensions
- --poscar
path to POSCAR file (if FORCE_SETS used)
- --primitive-axis
conventional to primitive cell transformation matrix
- --primitive-auto
Let phonopy automatically determine primitive cell transformation
- --symprec
tolerance for finding symmetry (default: 0.01)
Default:
0.01- --units, -u
Possible choices: THz, thz, cm-1, eV, ev, meV, mev
choose units of phonon frequency (THz, cm-1, eV, meV)
Default:
'THz'- --spg
space group number or symbol
- --density
k-point density along high-symmetry path
Default:
60- --seekpath
use seekpath to generate the high-symmetry path
Default:
False- --pymatgen
use pymatgen to generate the high-symmetry path
Default:
False- --cartesian
use cartesian k-point coordinates
Default:
False- --kpoints
specify a list of kpoints (e.g. “0 0 0, 0.5 0 0”)
- --labels
specify the labels for kpoints (e.g. “Gamma,X”)
- --height
height of the graph
- --width
width of the graph
- --ymin
minimum energy on the y-axis
- --ymax
maximum energy on the y-axis
- --style
matplotlib style specifications
- --no-base-style
prevent use of sumo base style
Default:
False- --config
colour configuration file
- --format
image file format (options: pdf, svg, jpg, png)
Default:
'pdf'- --dpi
pixel density for image file
- --font
font to use
- --dos
Phonopy .dat file for phonon DOS
- --to-json
Output JSON file for band data
- --from-json
Overlay band data from JSON files
- --to-web
(Output JSON file for http://henriquemiranda.github.io/phononwebsite)
- --legend
Legend labels. With no args, label json inputs with filenames. With one arg per json file, label json inputs only. With one extra arg, label all lines beginning with new plot.
Author: Alex Ganose Version: 1.0 Last updated: Jan 17, 2018