sumo-bandplot
sumo-bandplot is a program for generating publication-ready band structure diagrams.
A large number of features are provided, including the ability to project orbital
contributions on to the band structure.
Usage
The full range of options supported by sumo-bandplot are detailed in the Command-Line Interface section,
and be can be accessed using the command:
sumo-bandplot -h
To plot a band structure, simply run the following command in a folder containing a vasprun.xml or
vasprun.xml.gz file, which has been calculated along a high-symmetry path:
sumo-bandplot
The plot will be written to a file named band.pdf, with the raw band structure data written to band.dat.
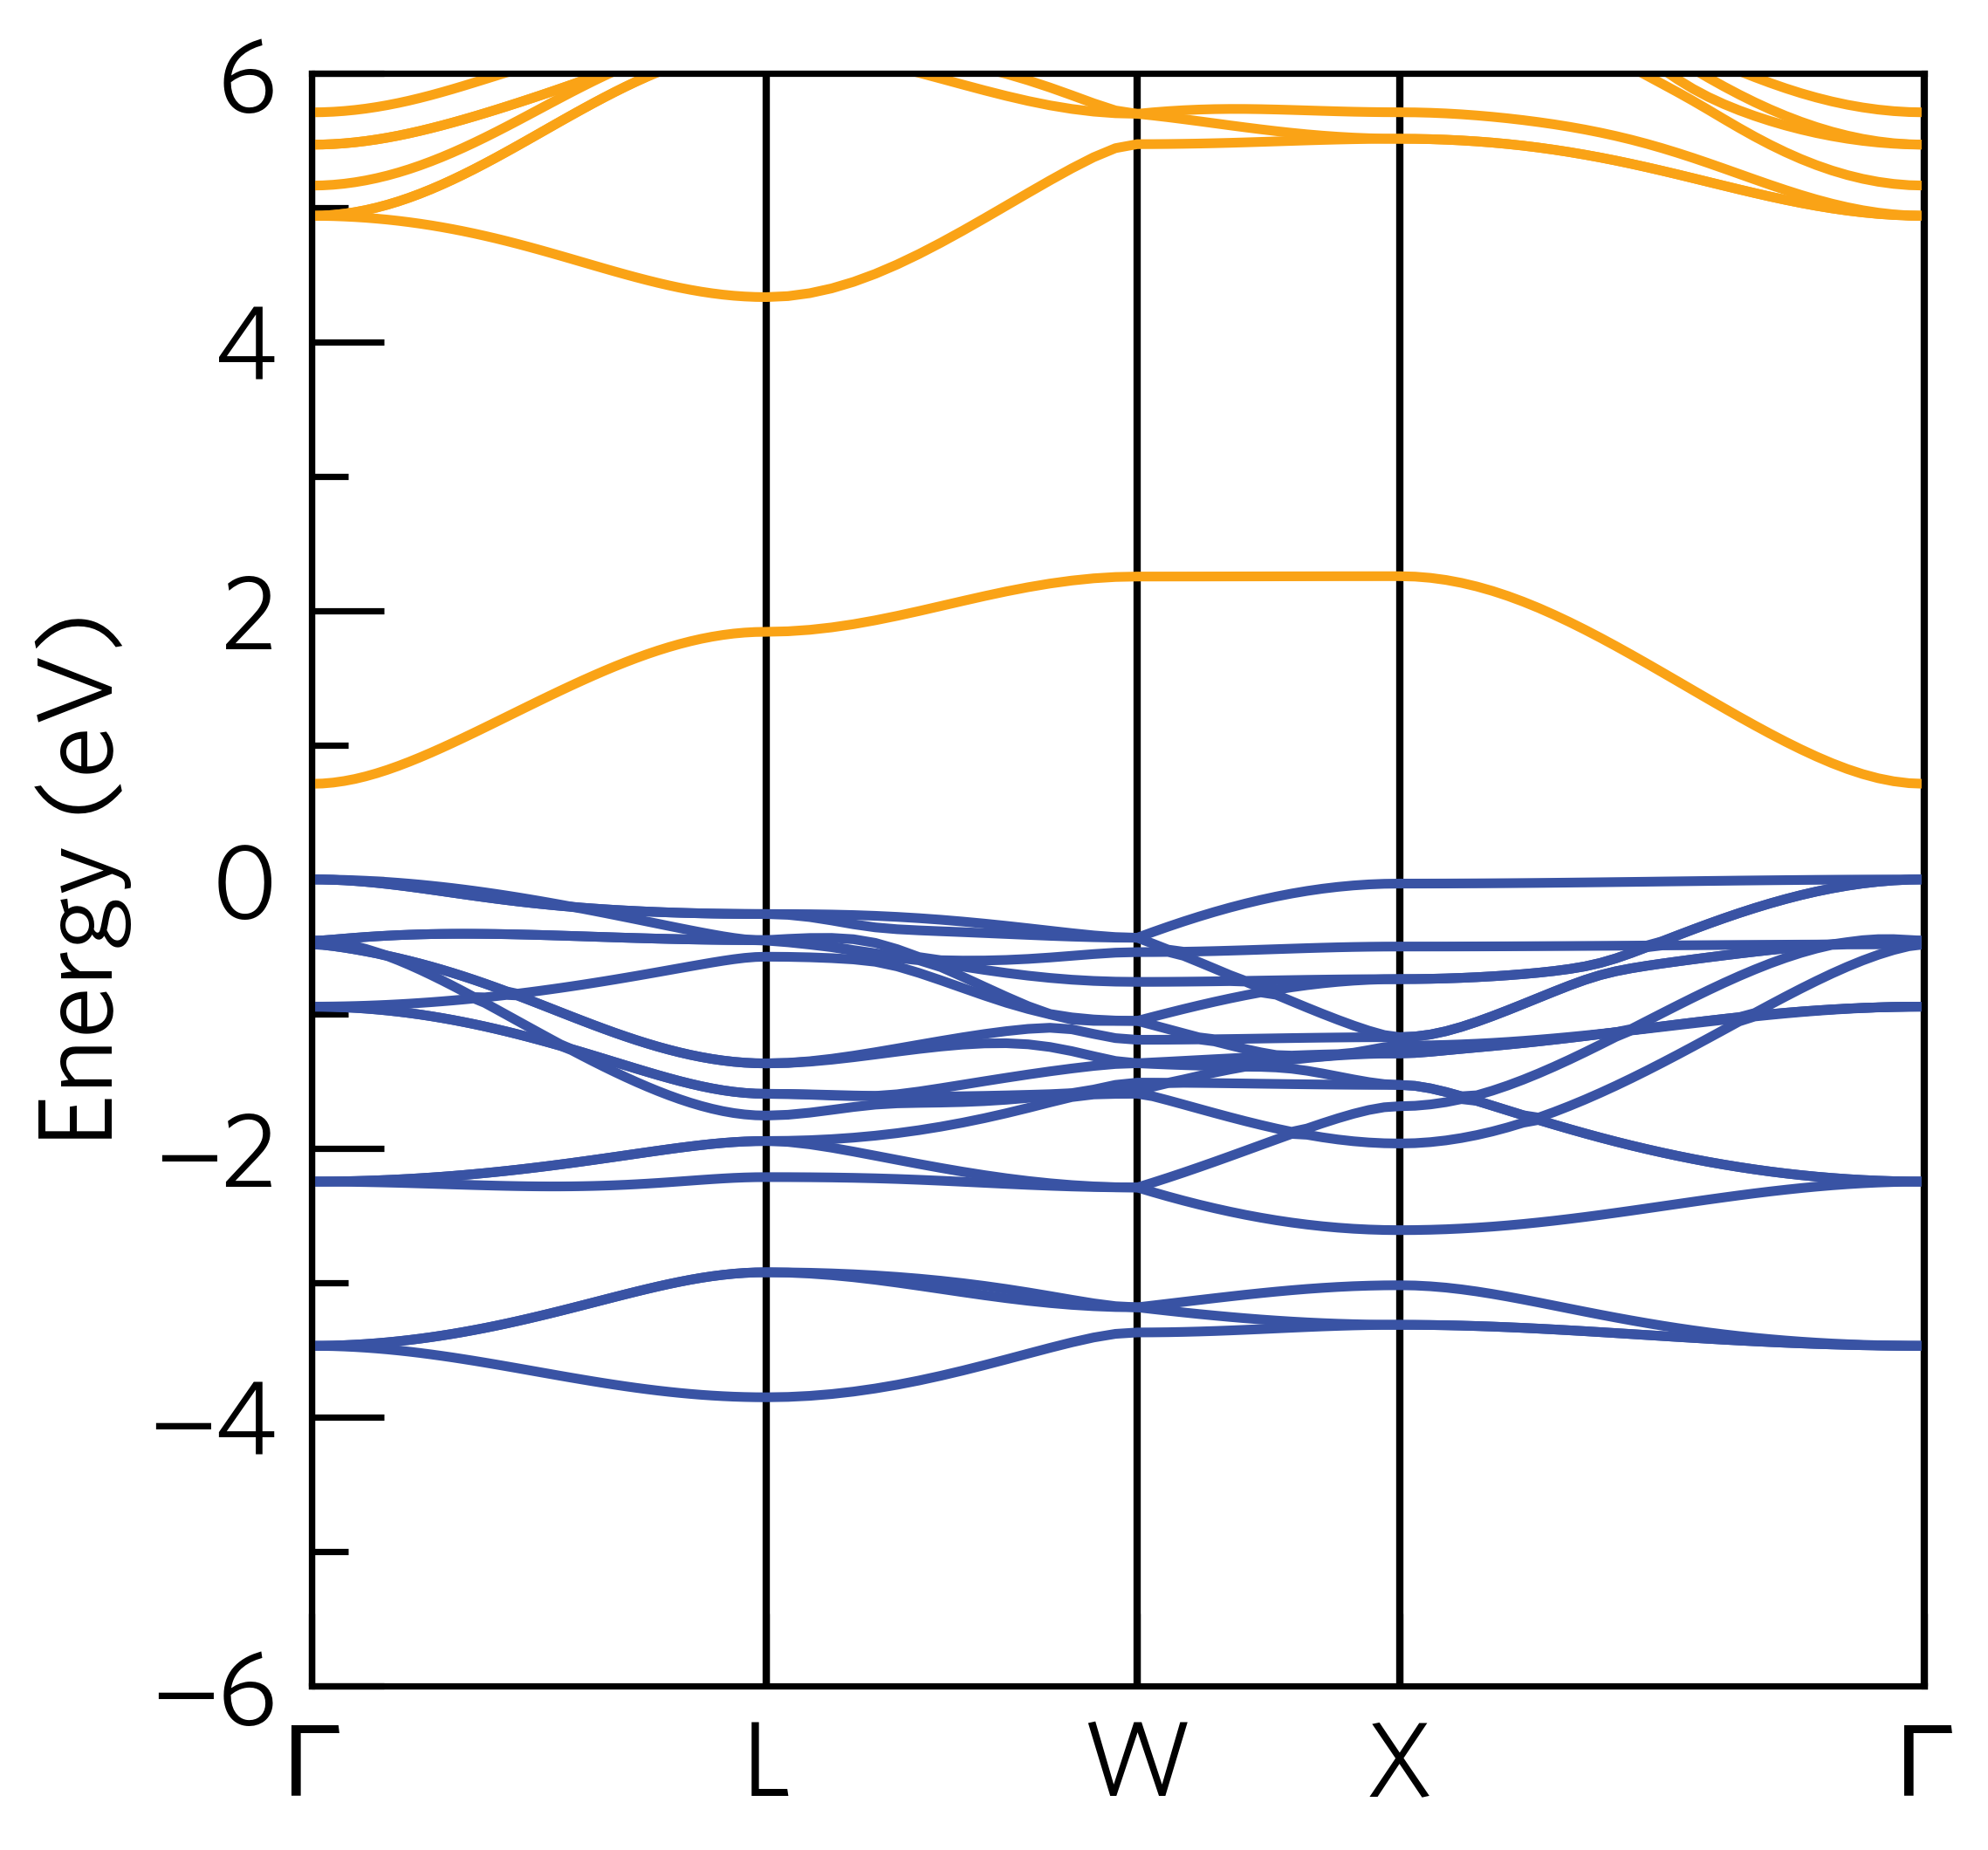
For example, if we run the command in the sumo/tests/data/Cs2SnI6/bandstructure directory, the band structure
should look like:
File Searching
sumo-bandplot will automatically look for vasprun.xml or vasprun.xml.gz files in the current
directory. If the band structure has been broken up into multiple parts (as is common
for hybrid band structure calculations), these files will be preferentially used. For this to work, the
folders should be named split-0* and sumo-bandplot should be run in the folder containing
the splits. For example, if the file structure is as follows:
bandstructure/
    split-01/
        KPOINTS
        vasprun.xml
    split-02/
        KPOINTS
        vasprun.xml
sumo-bandplot should be run in the bandstructure directory.
Basic Options
To specify a particular vasprun.xml to plot, the --filenames option can be used.
If multiple vasprun.xml files are provided, they will be combined into a single band
structure.
The valence band maximum and conduction band minimum can be highlighted using the --band-edges option.
The height, and width of the graphic, along with the y-axis limits, can be controlled via the
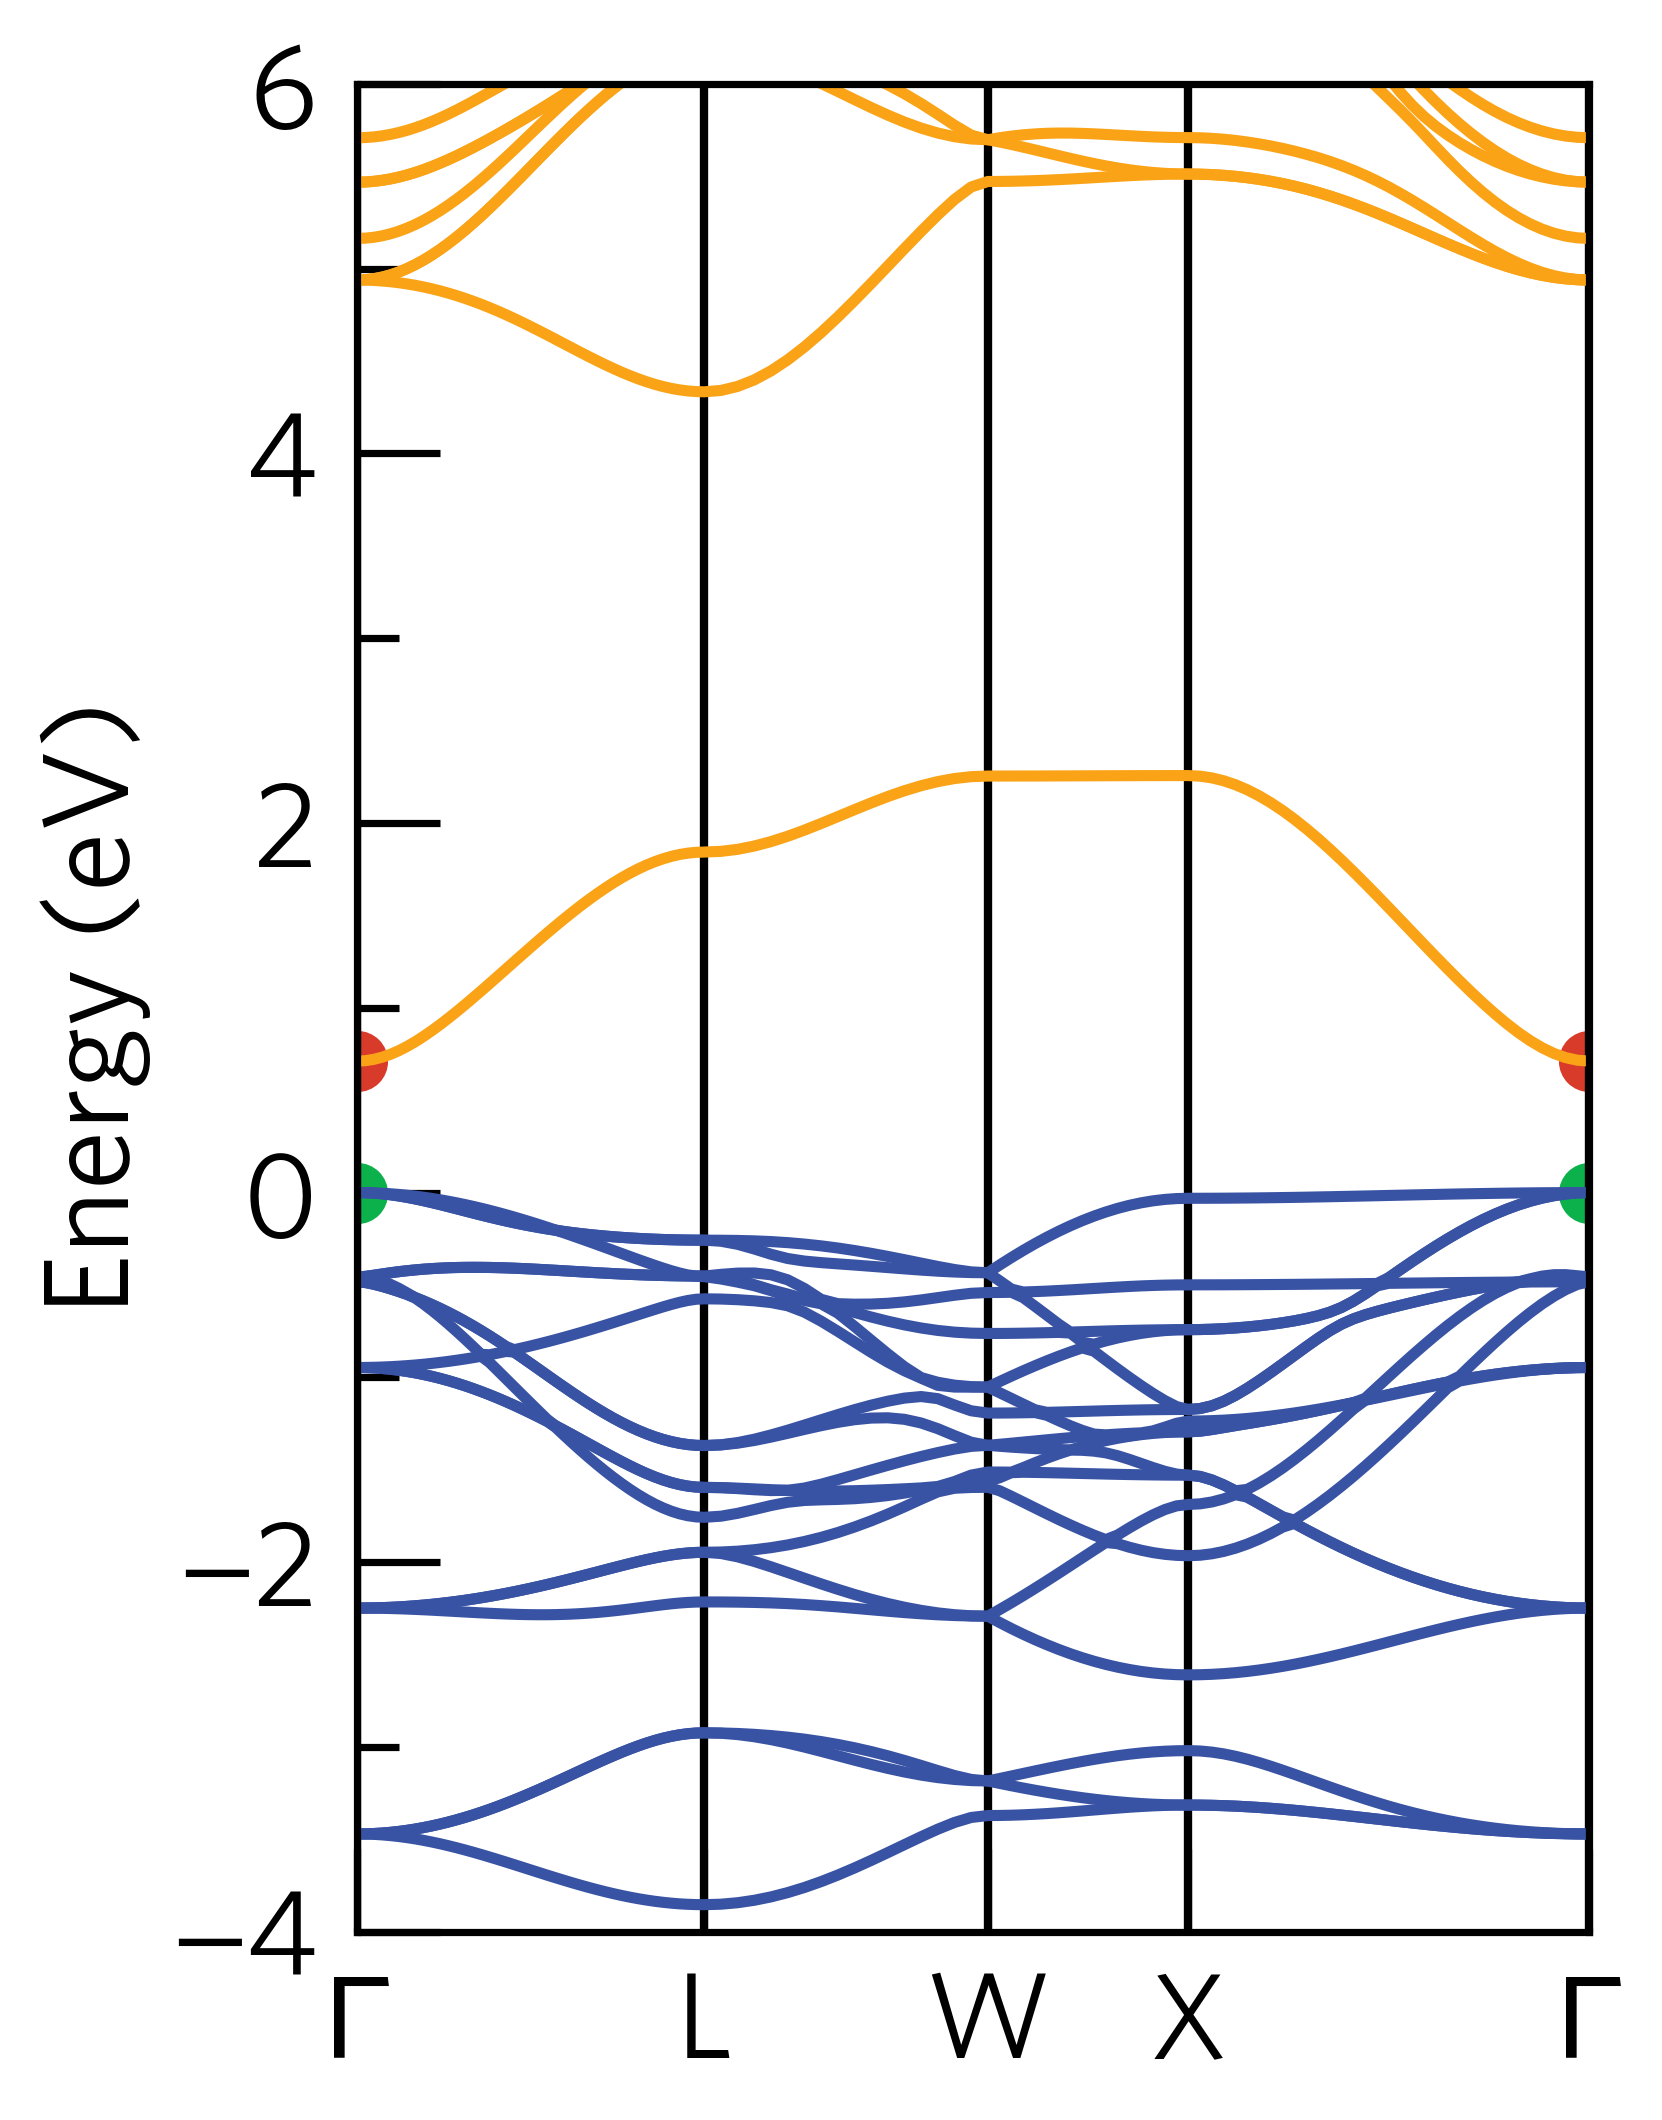
--width, --height, --ymax, and --ymin options. For example, the plot above could be
made more appealing using the following command:
sumo-bandplot --width 4 --ymin -4 --band-edges
Combined Band Structure and Density of States Plots
sumo-bandplot can be used to simultaneously plot a band structure and density of states,
using the --dos option. A vasprun.xml to use for the density of states information
is required as input. For example, if we run the following command in the
sumo/tests/data/Cs2SnI6/bandstructure folder, the output will look like:
sumo-bandplot --dos ../dos/vasprun.xml.gz --ymin -4
Many options are provided for controlling the density of states output. The usage of these
options is the same as in sumo-dosplot and described in more detail on
the sumo-dosplot page.
To control the number of items that appear in the legend, see Legend Labels.
For plotting specific orbital or atomic contributions, see Selective Plotting of Specific Orbitals and Atoms.
Furthermore, the colours of the lines in the density of states can be controlled
by a configuration file (--config). See Custom Line Colours for more details.
Projected Band Structures
sumo-bandplot can produce projected band structures, where the orbital contributions
to a band are plotted. This behaviour is accessed using the --project option.
The syntax for specifying which orbitals to project is as follows:
Elements are identified using their symbol from the
POSCARMultiple elements are separated via commas.
Specific orbitals can be chosen by adding the orbital after the element using a period as a separator.
If multiple orbitals are included for a single element definition, these will be combined into a single contribution.
If no orbitals are specified but the atomic symbol is included, then all orbitals of that element will be combined.
Multiple definitions for the same element are allowed (e.g. each specifying different orbitals).
For example, to project the Sn s orbitals, the Sn p orbitals and a combined contribution from all the I orbitals, the command would be:
sumo-bandplot --project Sn.s,Sn.p,I
For projected plots, the band structure and the projections are interpolated to ensure the bands are
smooth. The degree of interpolation can be controlled by the --interpolate-factor option.
The default is 4, meaning the density of the eigenvalues and projections is quadrupled.
Multiple projection modes are supported. These are controlled by the --mode option.
RGB Mode
The default is --mode rgb. Here the line colour depends on the character of the band. Each
element or orbital contributes either red, green or blue, with the corresponding line colour
a mixture of all three colours. This mode only supports up to 3 element/orbitals combinations.
The order of the elements/orbitals determines which colour is used for each selection.
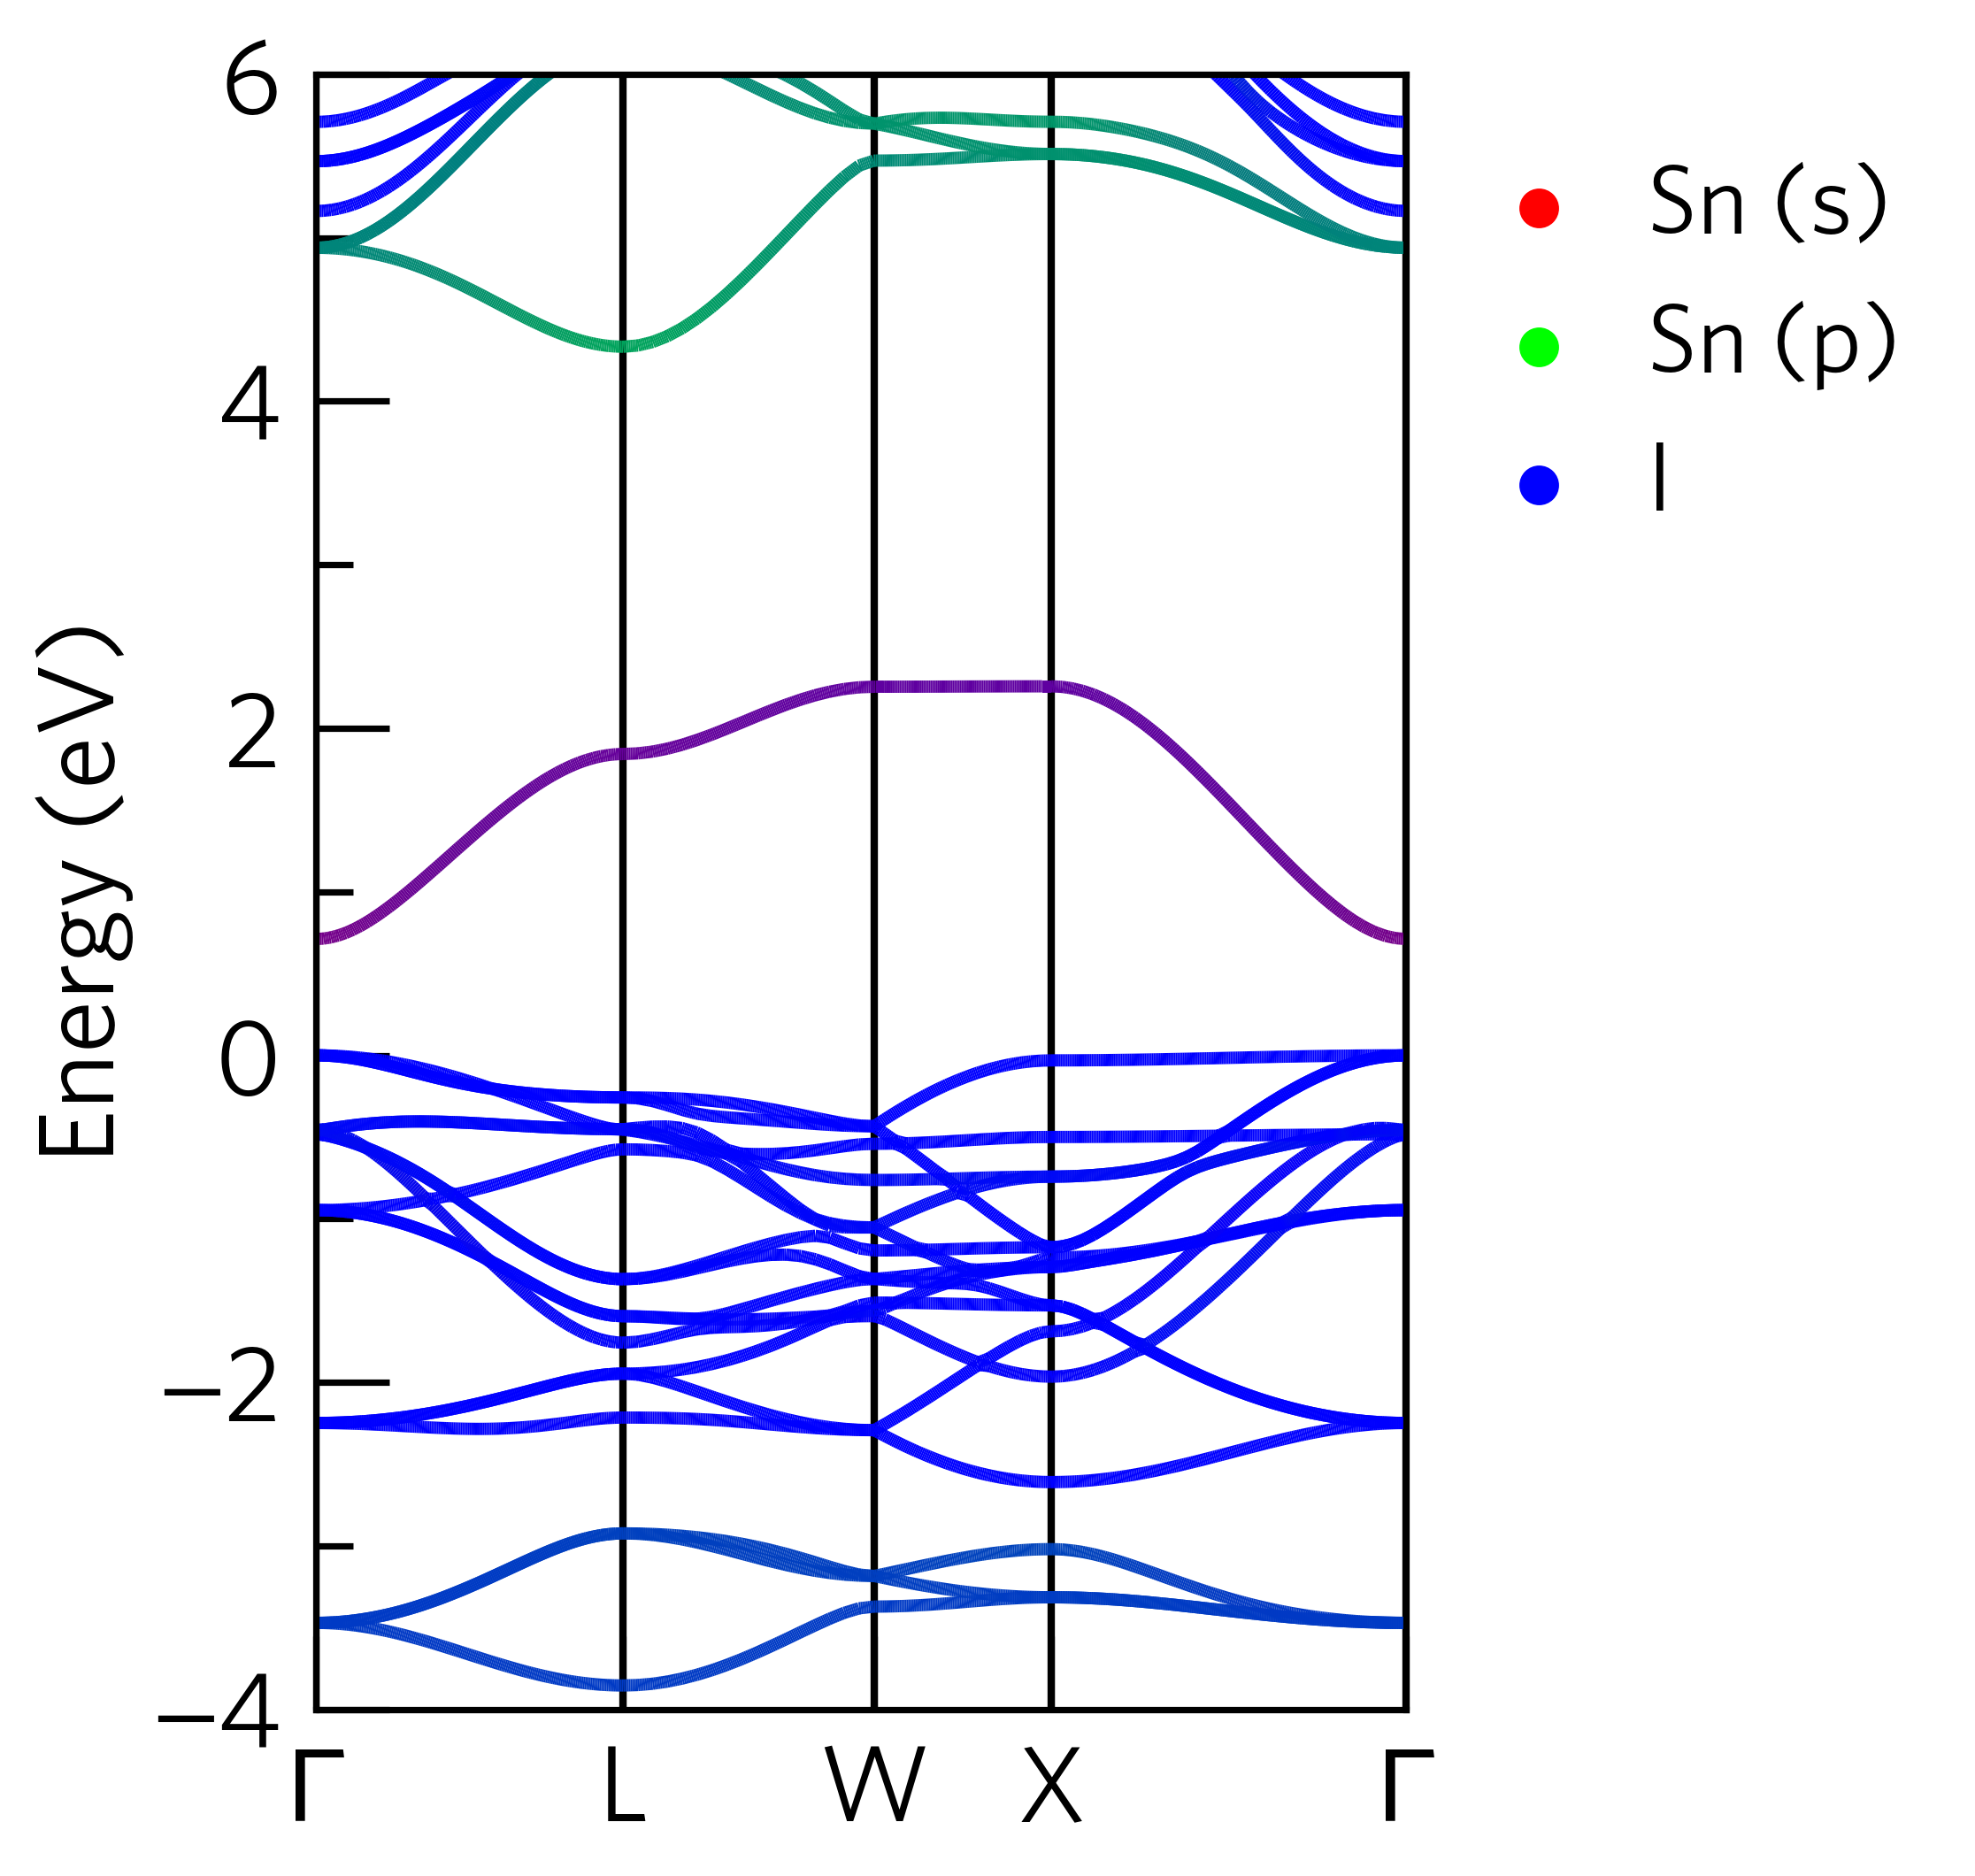
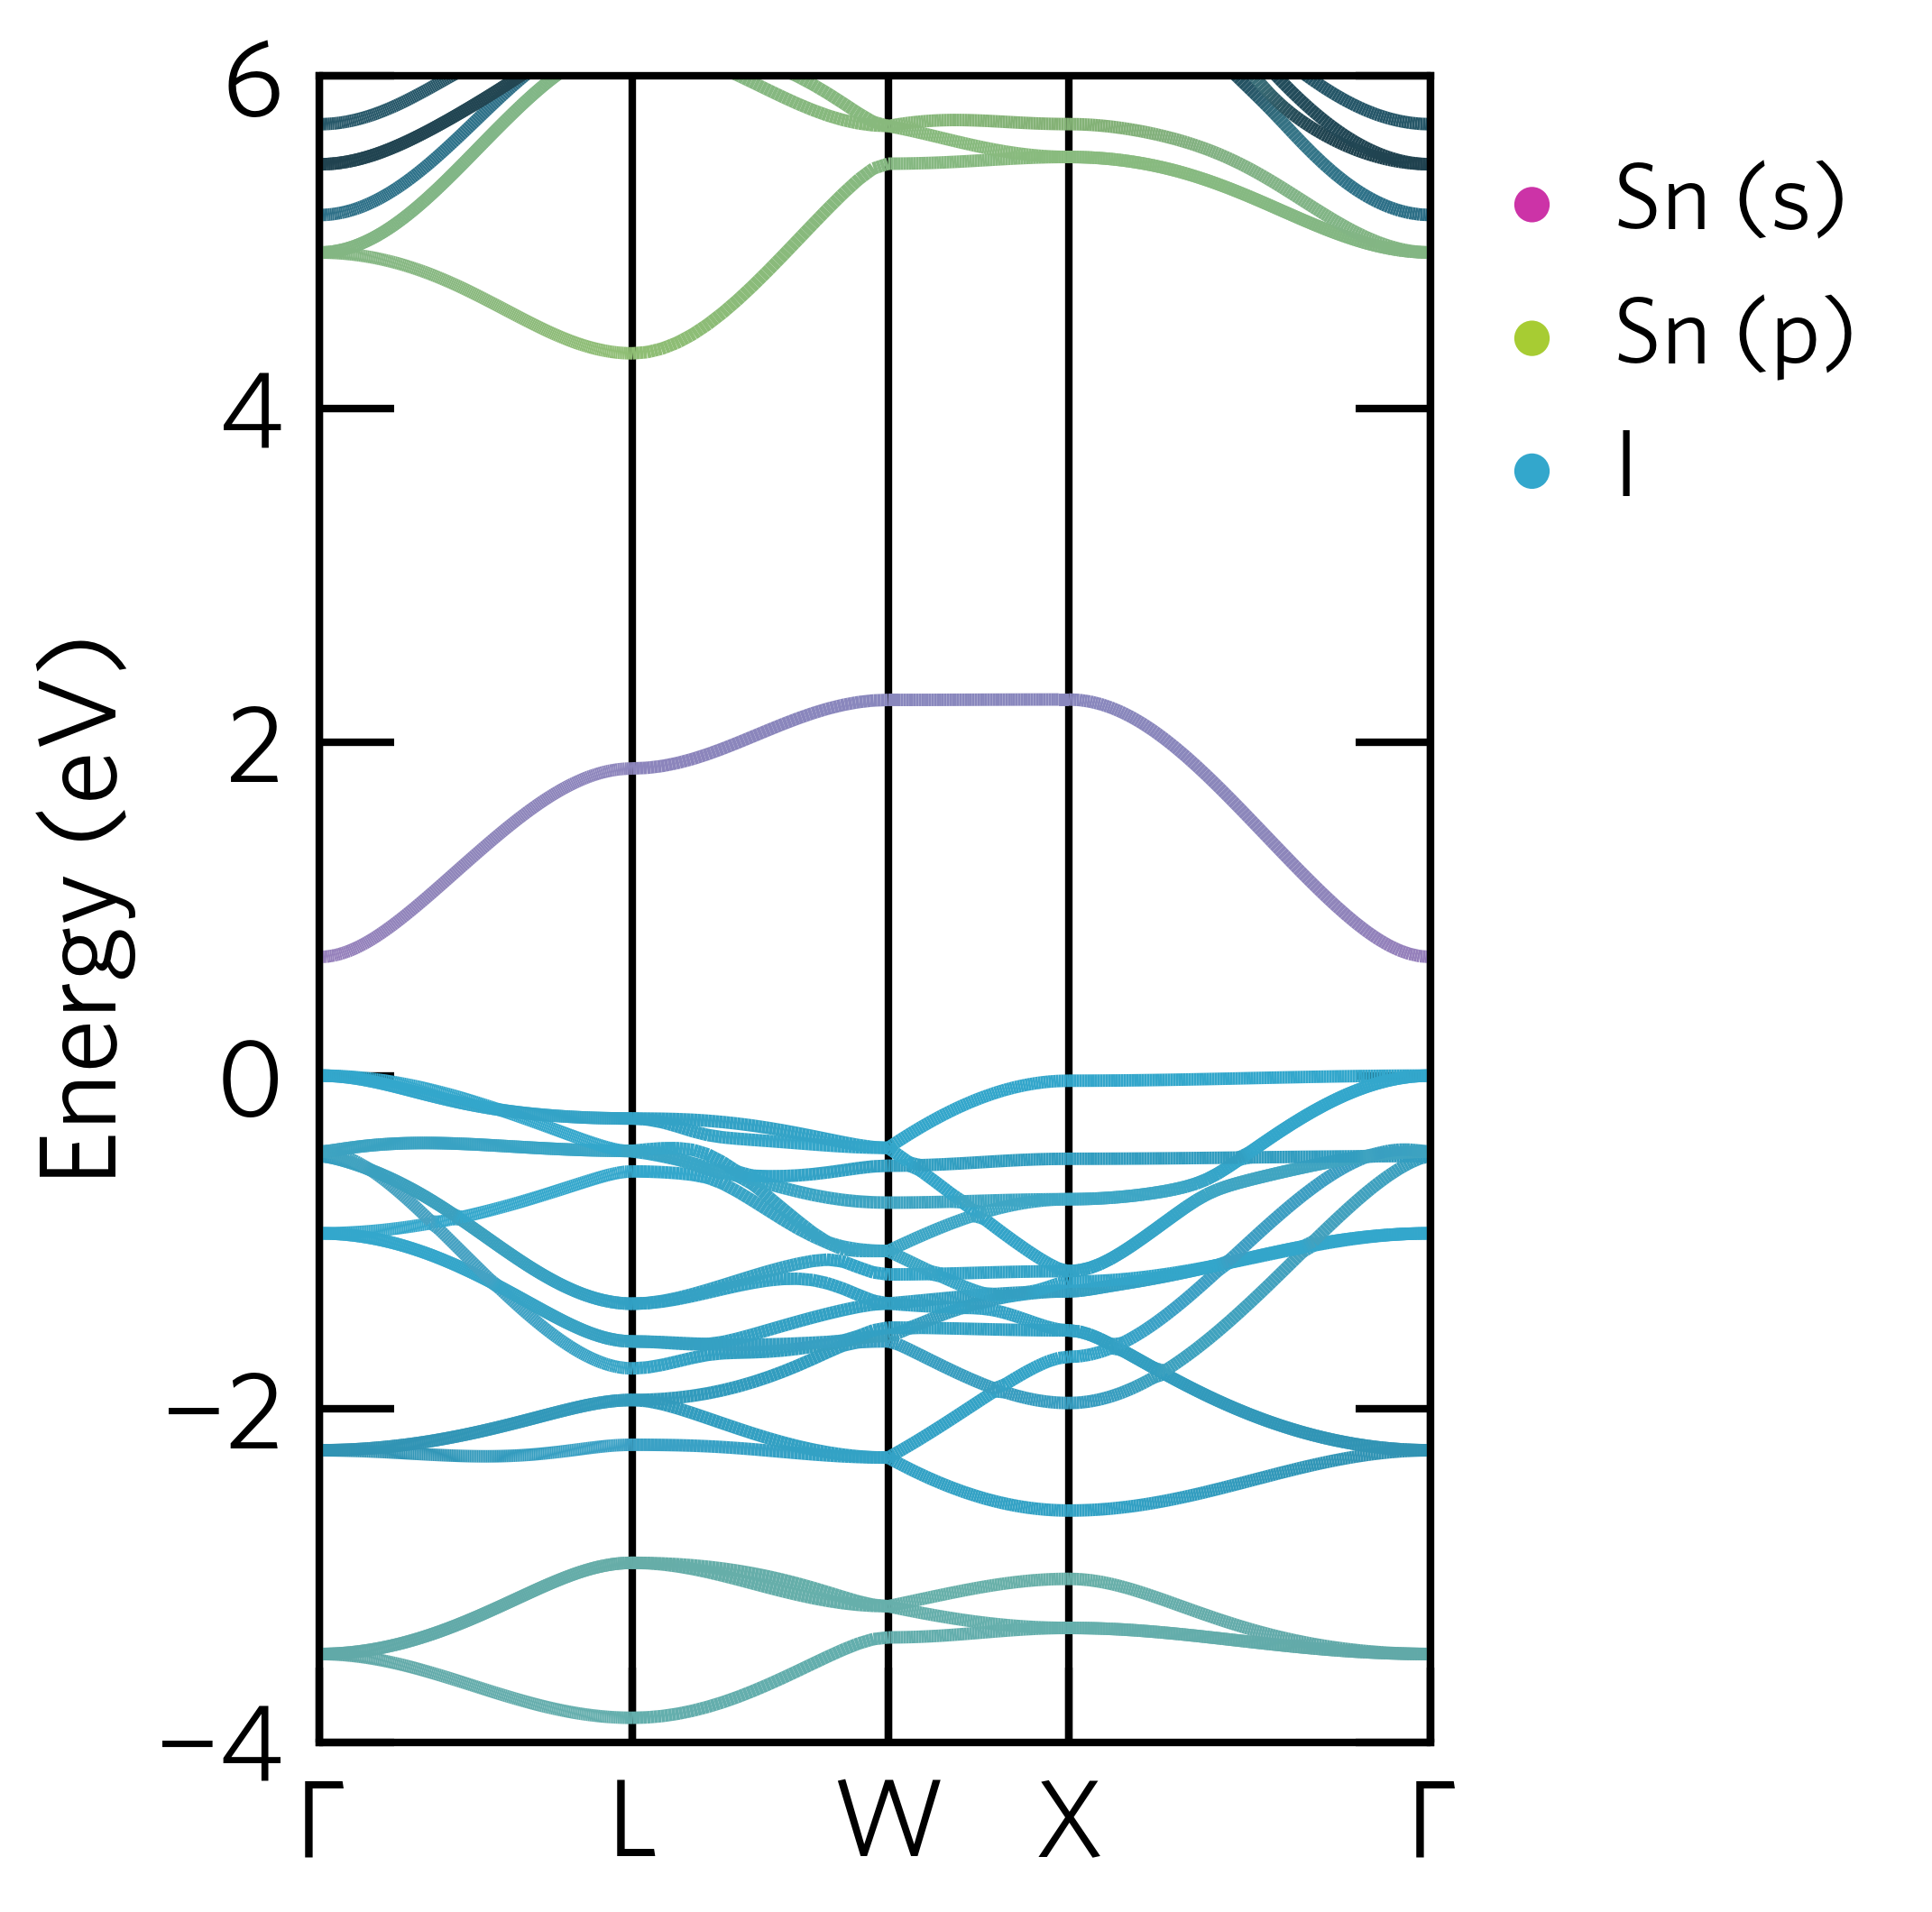
For example, if the following command is run in the sumo/tests/data/Cs2SnI6/bandstructure directory,
the output should look like:
sumo-bandplot --project Sn.s,Sn.p,I --ymin -4 --width 4
RGB Mode (custom colours)
Custom colours can be specified in RGB mode using the --colour1, --colour2, and
colour3 options. Furthermore, by default, colour interpolation is performed in LAB
colourspace for more natural transitions between colours. An alternative colourspace
can be specified using the --colourspace option.
For example, if the following command is run in the sumo/tests/data/Cs2SnI6/bandstructure directory,
the output should look like:
sumo-bandplot --project Sn.s,Sn.p,I --ymin -4 --width 4 --colour1 "#CC33A7" --colour2 "#A7CC33" --colour3 "#33A7CC"
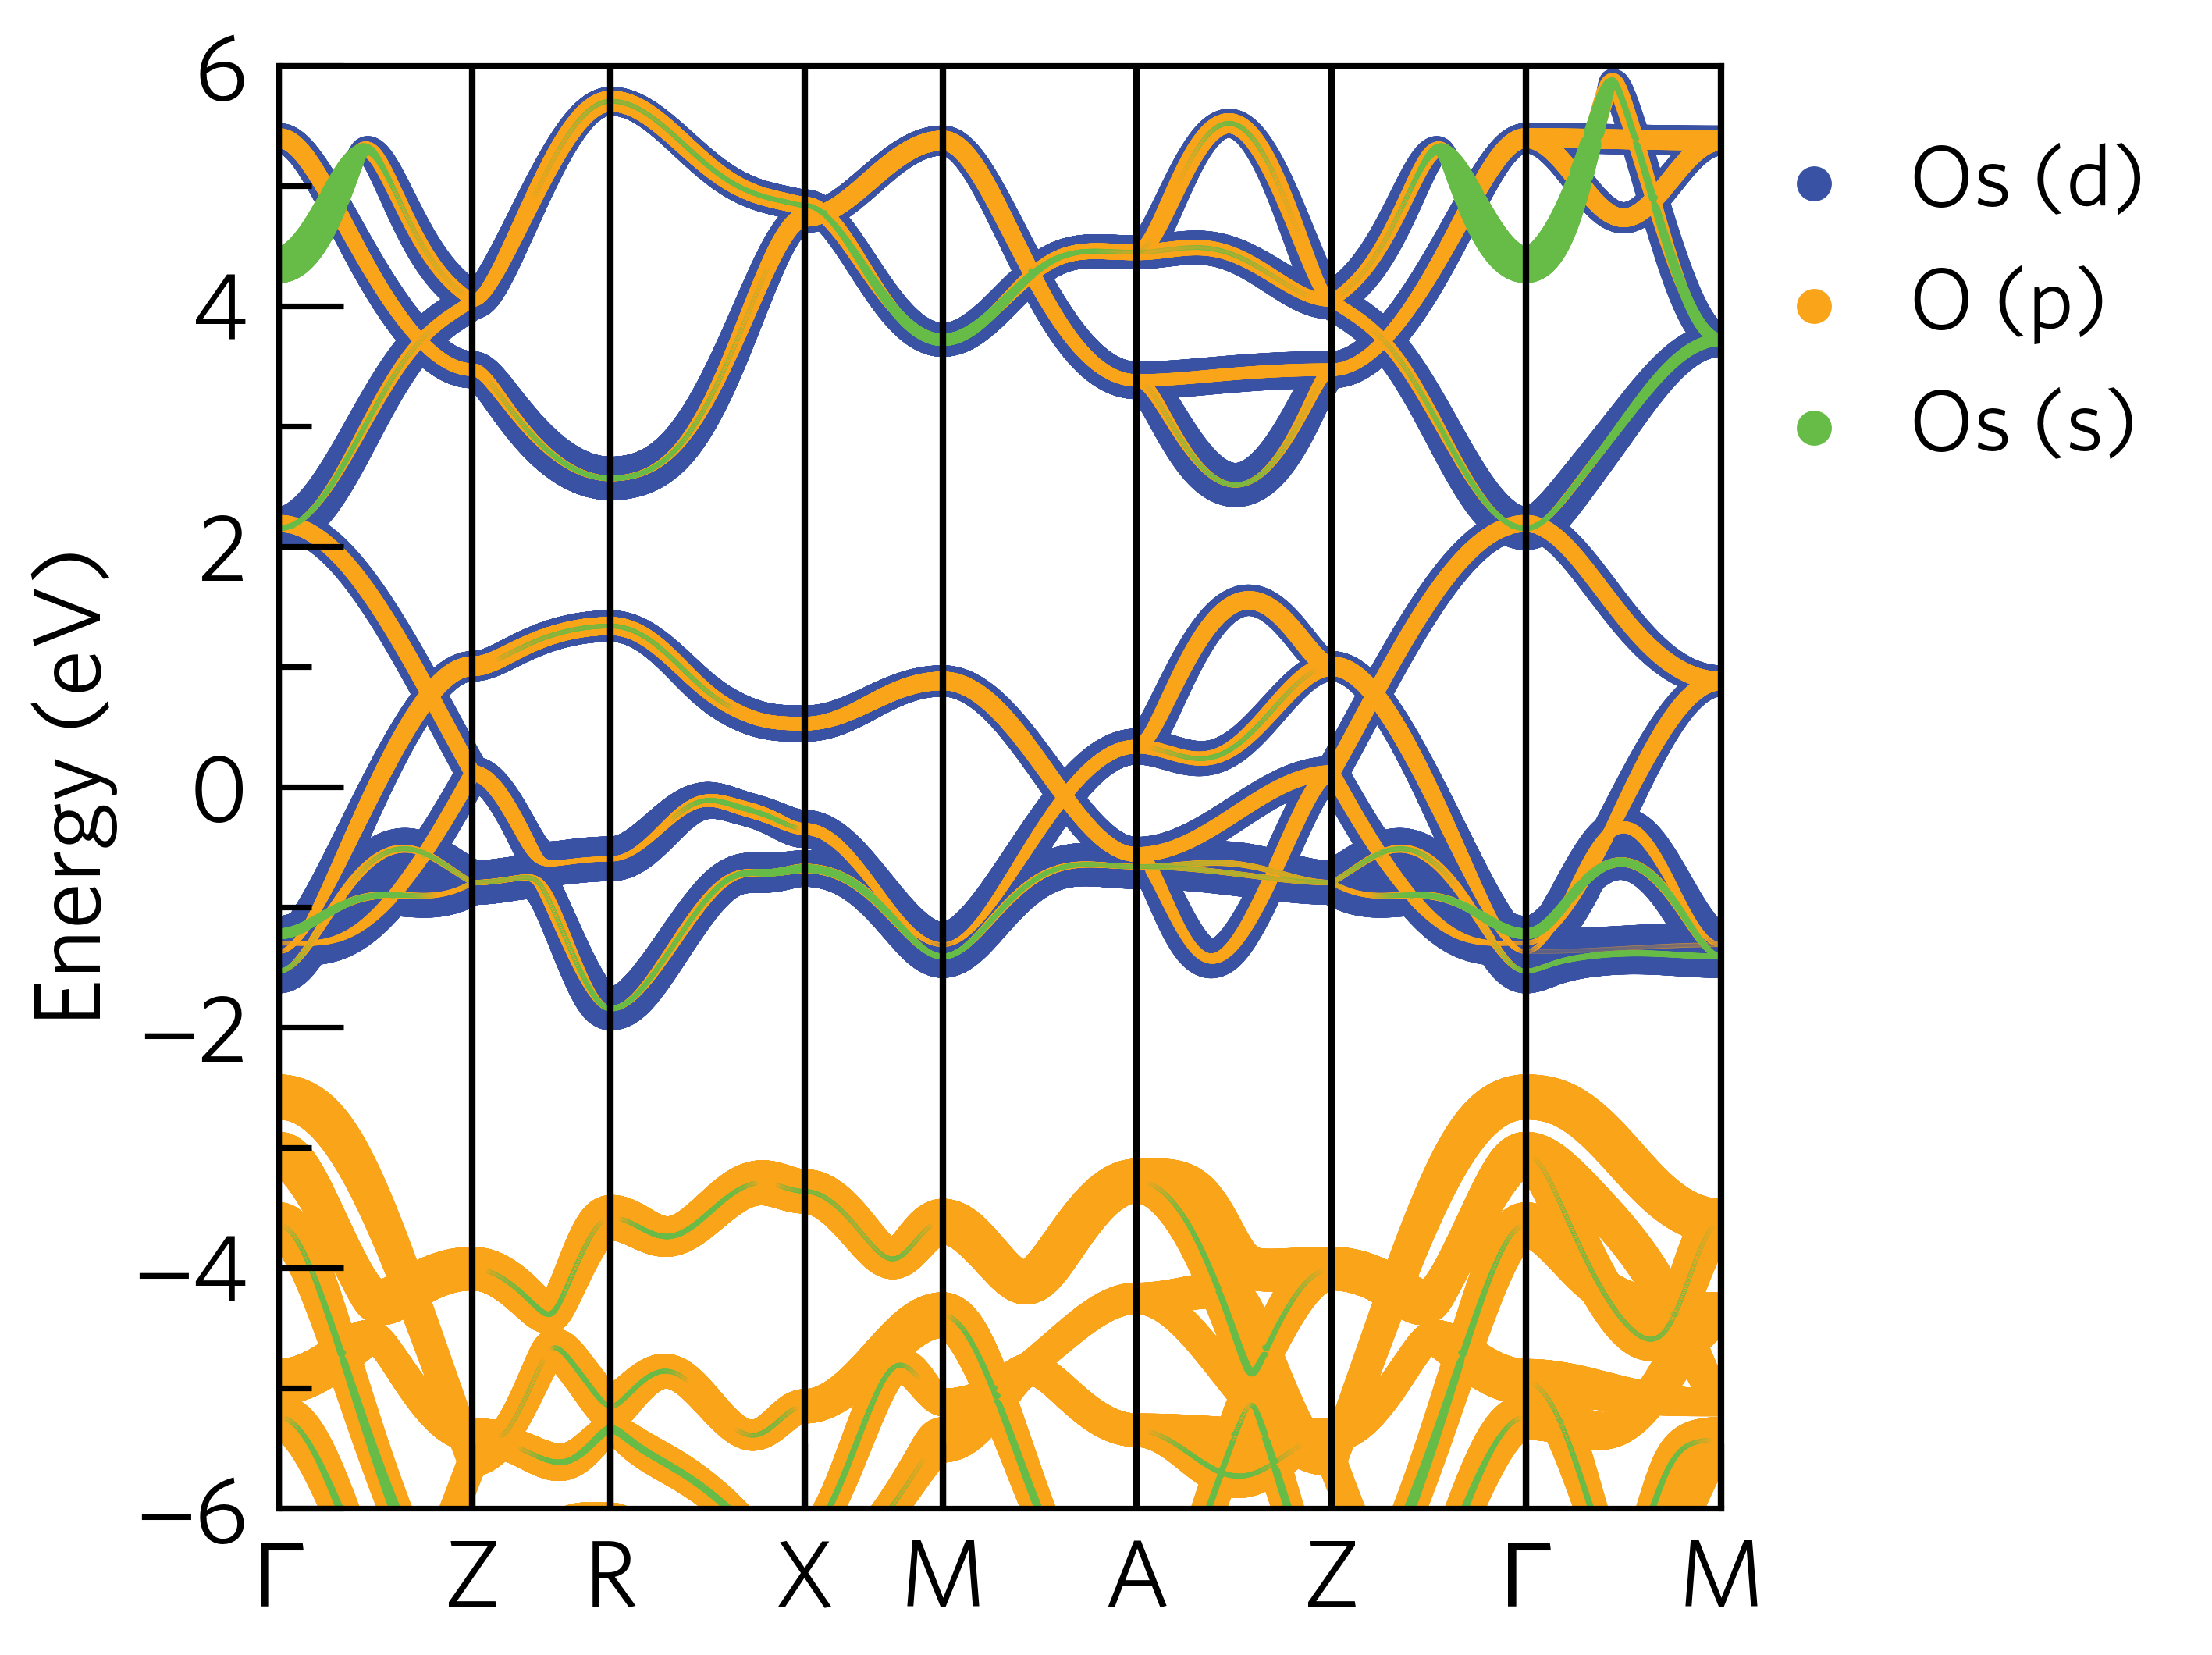
Stacked Mode
If using --mode stacked, the element or orbital contributions are drawn as a series of stacked
circles. The size of the circles can be scaled using the --circle-size option. This mode supports
an unlimited number of element/orbital contributions.
For example, if the following command is run in the sumo/tests/data/OsO2/bandstructure directory,
the output should look like:
sumo-bandplot --project Os.d,O.p,Os.s --mode stacked --circle-size 90
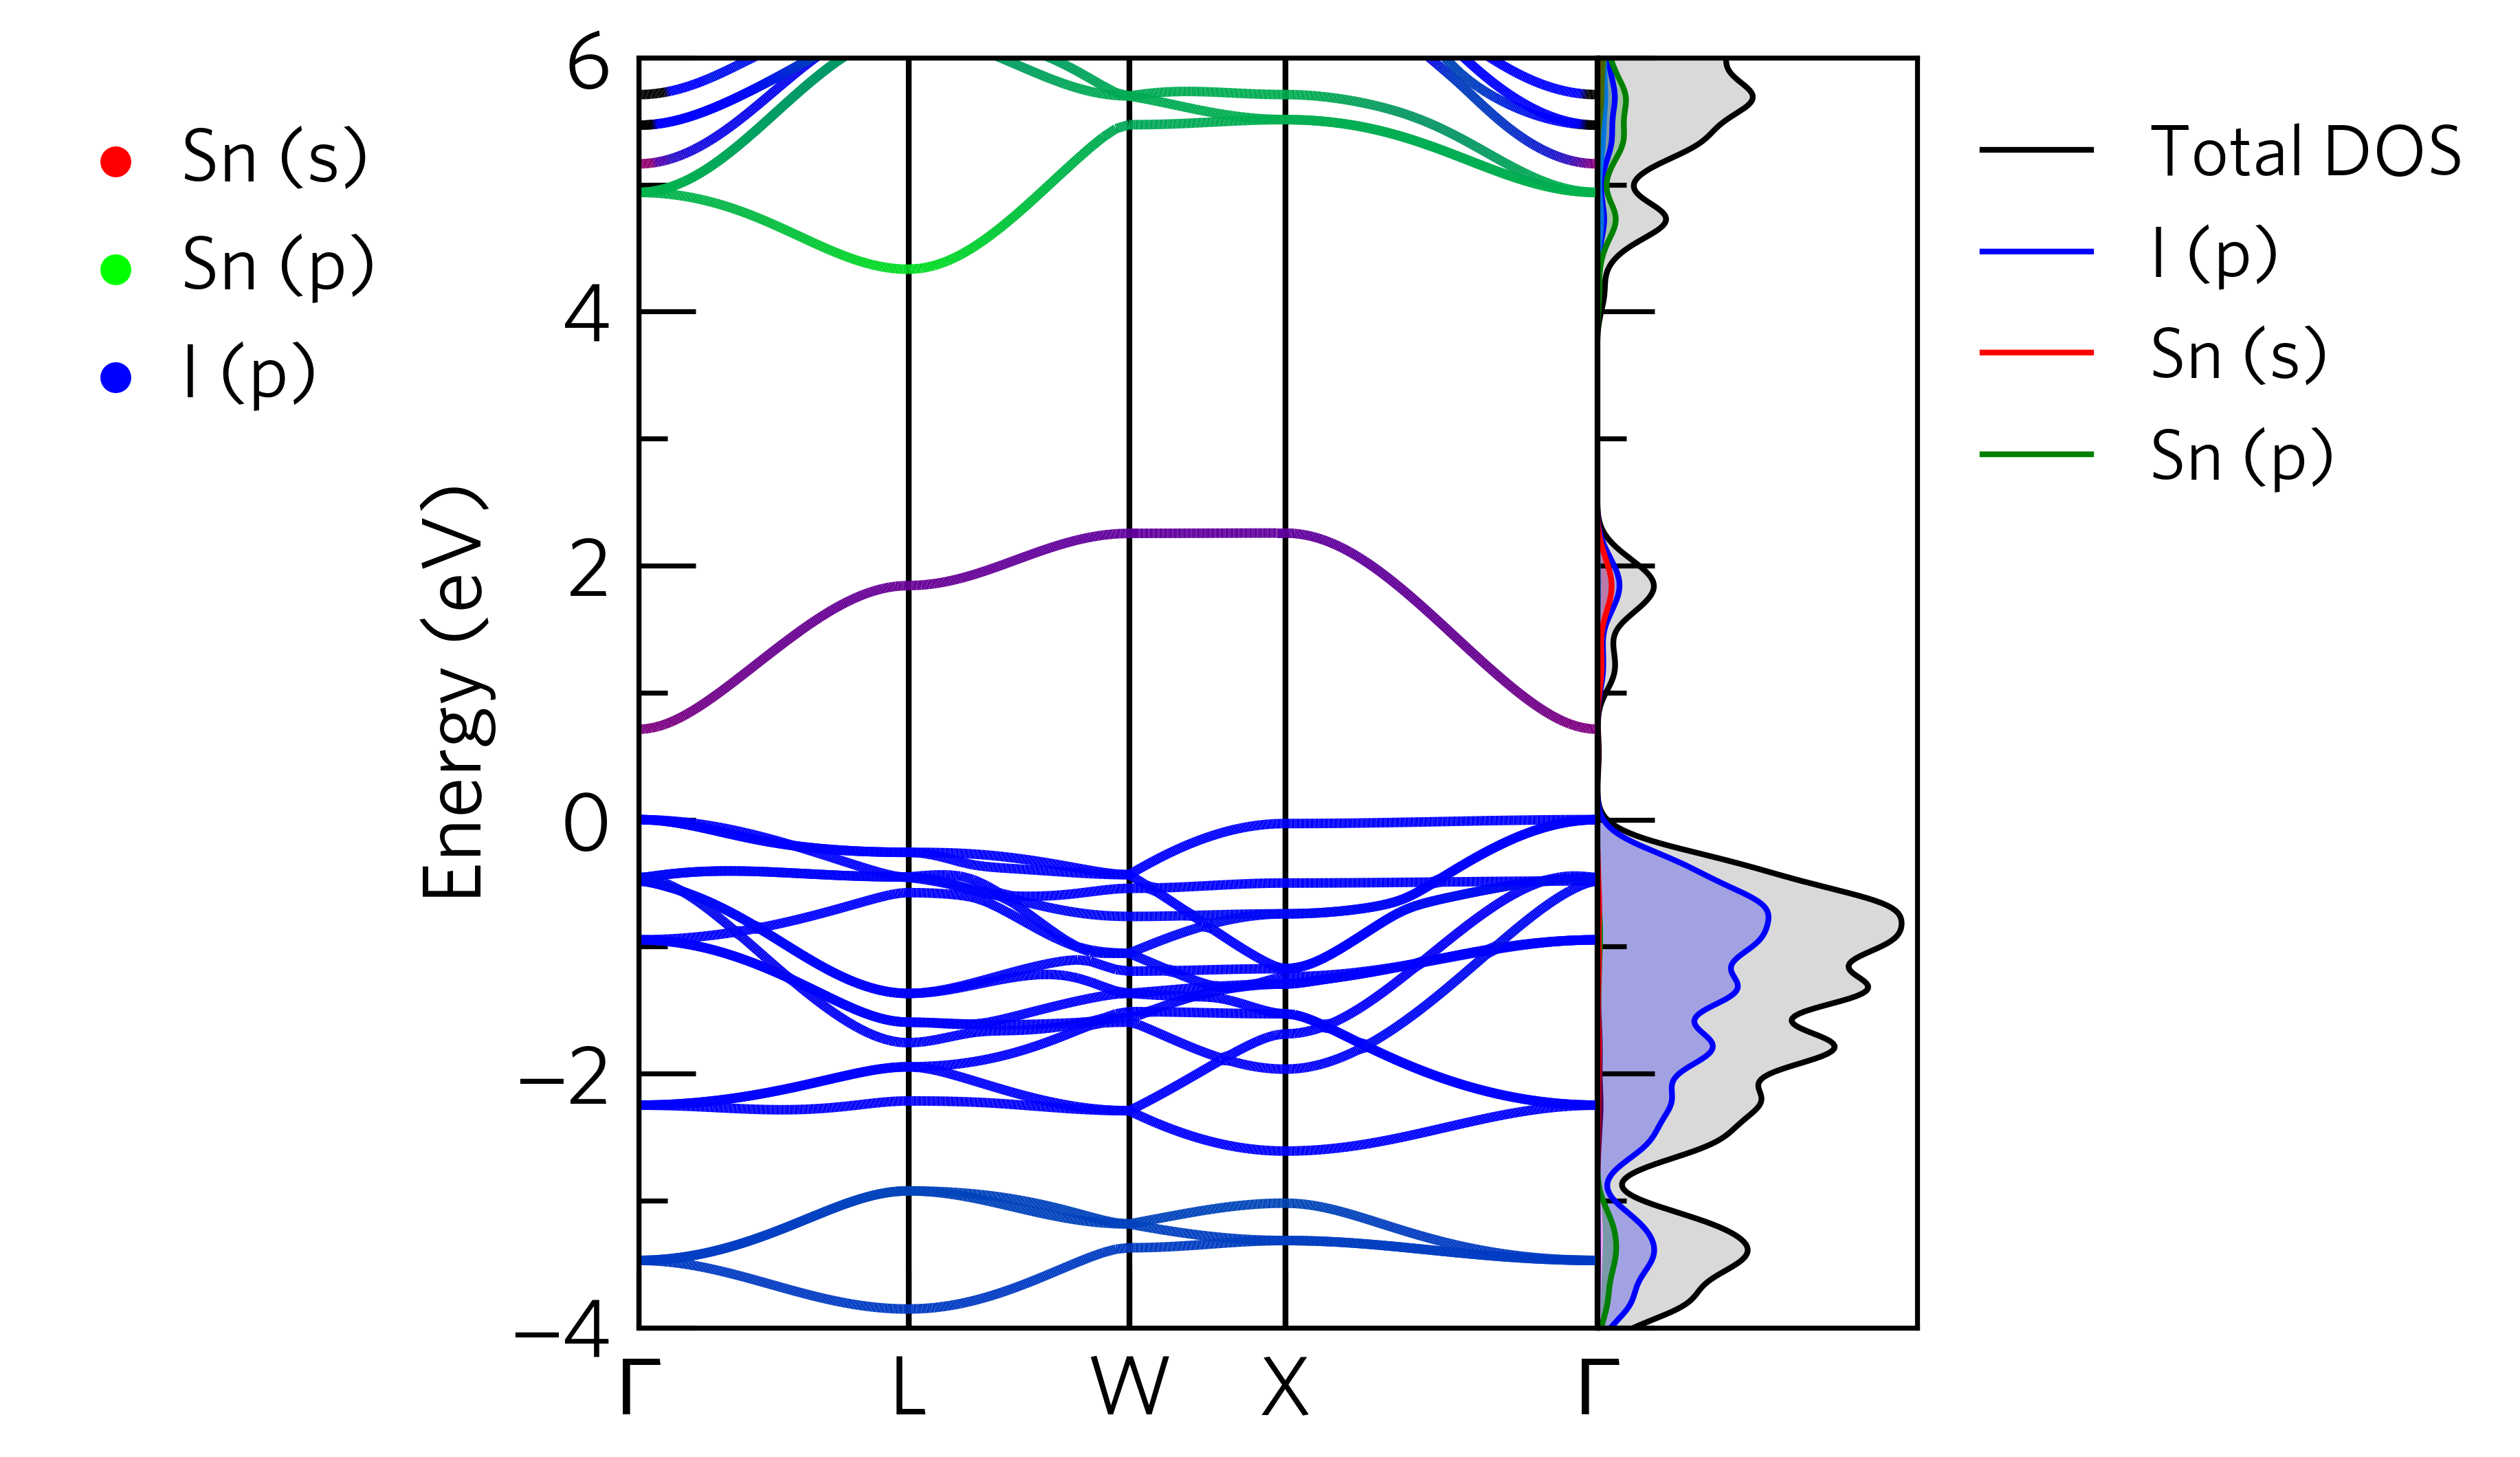
Advanced Example
It is possible to combine both the --density and --project keywords. For best results,
it is advised to use a configuration file (see Custom Line Colours) to ensure the colours
are consistent.
For example, using the following configuration file (stored in this
example as my_colours.conf):
[I]
p = b

[Sn]
s = r
p = g
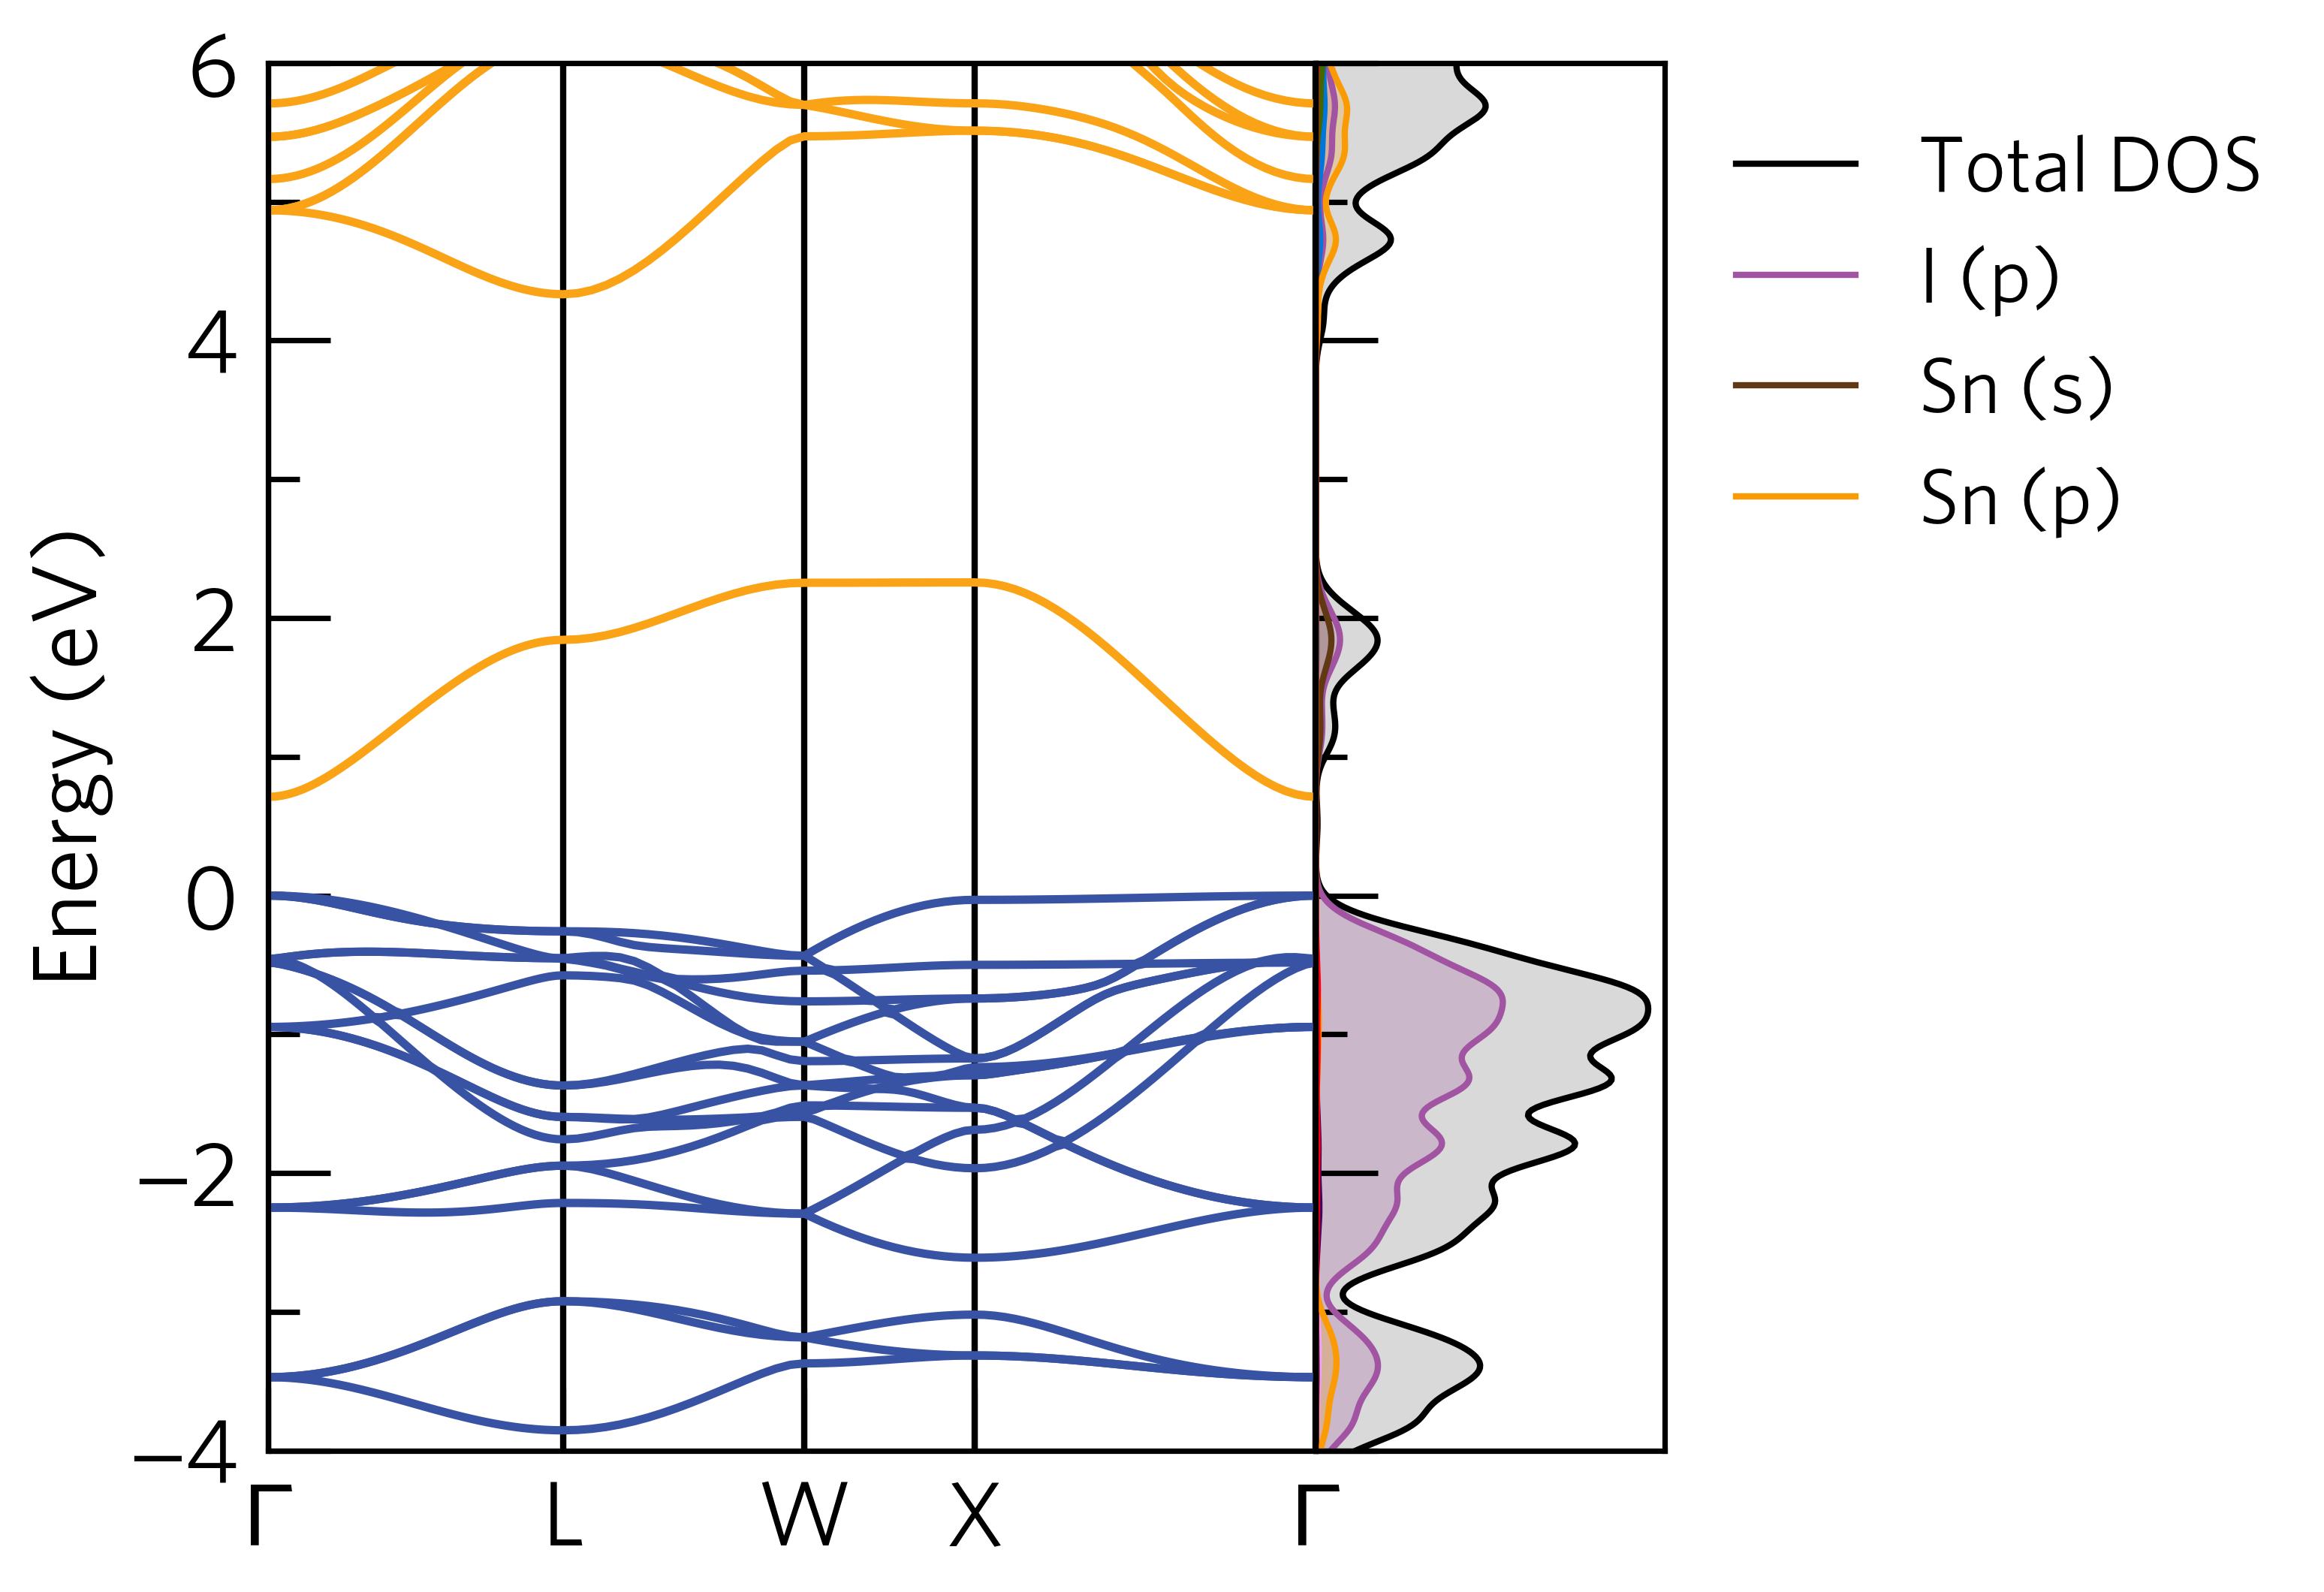
The following command, run in the sumo/tests/docs/Cs2SnI6/bandstructure folder, should output the graphic below:
sumo-bandplot  --dos ../dos/vasprun.xml.gz \
                --project Sn.s,Sn.p,I.p \
                --config my_colours.conf \
                --ymin -4
Questaal
Basic band structure plotting is supported for LMTO calculations with
Questaal using lmf. (Orbital projection is not currently included.)
A structure file (site.ext), symmetry lines file (syml.ext) and band structure output file (bnds.ext) should be present in the same directory with the same ext identifier. You can then plot with Sumo:
sumo-bandplot --code questaal -f bnds.ext
The usual appearance options are supported.
Command-Line Interface
bandplot is a script to produce publication-ready band structure diagrams
usage: sumo-bandplot [-h] [-f F [F ...]] [-c CODE] [-p P] [-d D] [-b]
                     [--project S] [--mode MODE] [--normalise NORMALISE]
                     [--interpolate-factor N] [--cartesian] [--colour1 C]
                     [--colour2 C] [--colour3 C] [--colourspace C]
                     [--circle-size S] [--ylabel YLABEL]
                     [--dos-label DOS_LABEL] [--dos DOS] [--zero-line]
                     [--zero-energy ZERO_ENERGY] [--elements E] [--orbitals O]
                     [--atoms A] [--spin SPIN] [--scissor SCISSOR]
                     [--total-only] [--no-total] [--legend-cutoff C] [-g G]
                     [--scale SCALE] [--height HEIGHT] [--width WIDTH]
                     [--ymin YMIN] [--ymax YMAX] [--style STYLE [STYLE ...]]
                     [--no-base-style] [--config CONFIG] [--format FORMAT]
                     [--dpi DPI] [--font FONT] [--title TITLE]
Named Arguments
- -f, --filenames
one or more vasprun.xml files to plot
- -c, --code
Electronic structure code (default: vasp).”questaal” also supported.
Default:
'vasp'- -p, --prefix
prefix for the files generated
- -d, --directory
output directory for files
- -b, --band-edges
highlight the band edges with markers
Default:
False- --project
select which orbitals to project onto the band structure (e.g. “Zn.s,Zn.p,O”)
- --mode
mode for orbital projections (options: rgb, stacked)
Default:
'rgb'- --normalise
how to normalise projections (options: all, select)
Default:
'all'- --interpolate-factor
interpolate factor for band structure projections (default: 4)
Default:
4- --cartesian
Read cartesian k-point coordinates. This is only necessary for some Questaal calculations; Vasp outputs are less ambiguous and this option will be ignored if –code=vasp.
Default:
False- --colour1
colour1 for rgb projections (default: red)
Default:
'#FF0000'- --colour2
colour2 for rgb projections (default: blue)
Default:
'#0000FF'- --colour3
colour3 for rgb projections (default: green)
Default:
'#00FF00'- --colourspace
colorspace used for interpolation of for rgb projections (options: lab[default], rgb, hsv, luvlc, lablch, and xyz)
Default:
'lab'- --circle-size
circle size for “stacked” projections (default: 150)
Default:
150- --ylabel
y-axis (i.e. energy) label/units
Default:
'Energy (eV)'- --dos-label
Axis label for DOS if included
- --dos
path to density of states vasprun.xml
- --zero-line
Plot horizontal line at energy zero
Default:
False- --zero-energy
Reference energy: energy will be shifted to place this energy at zero. If not specified, zero will be set to the VBM.
- --elements
elemental orbitals to plot (e.g. “C.s.p,O”)
- --orbitals
orbitals to split into lm-decomposed contributions (e.g. ‘Ru.d’)
- --atoms
atoms to include (e.g. “O.1.2.3,Ru.1.2.3”)
- --spin
select only one spin channel for a spin-polarised calculation (options: up, 1; down, -1)
- --scissor
apply scissor operator
- --total-only
only plot the total density of states
Default:
False- --no-total
don’t plot the total density of states
Default:
True- --legend-cutoff
cut-off in % of total DOS that determines if a line is given a label (default: 3)
Default:
3- -g, --gaussian
standard deviation of DOS gaussian broadening
- --scale
scaling factor for the density of states
Default:
1- --height
height of the graph
- --width
width of the graph
- --ymin
minimum energy on the y-axis
Default:
-6.0- --ymax
maximum energy on the y-axis
Default:
6.0- --style
matplotlib style specifications
- --no-base-style
prevent use of sumo base style
Default:
False- --config
colour configuration file
- --format
image file format (options: pdf, svg, jpg, png)
Default:
'pdf'- --dpi
pixel density for image file
Default:
400- --font
font to use
- --title
plot title
Author: Alex Ganose Version: 1.0 Last updated: July 18, 2017