sumo-dosplot
sumo-dosplot is a program for generating publication-ready density of states diagrams and extracting
the density of states from VASP calculations. A large number of features are provided, including
the ability to break the density of states down into the contributions from specific elements,
orbitals, and atoms.
Usage
The full range of options supported by sumo-dosplot are detailed in the Command-Line Interface section,
and be can be accessed using the command:
sumo-dosplot -h
To plot a density of states, simply run the following command in a folder containing a vasprun.xml or
vasprun.xml.gz file:
sumo-dosplot
The plot will be written to a file named dos.pdf, with the raw density of states data written to a series
files. These will be named total_dos.dat, with additional files named El_dos.dat where el is an
element name, for each element in the structure.
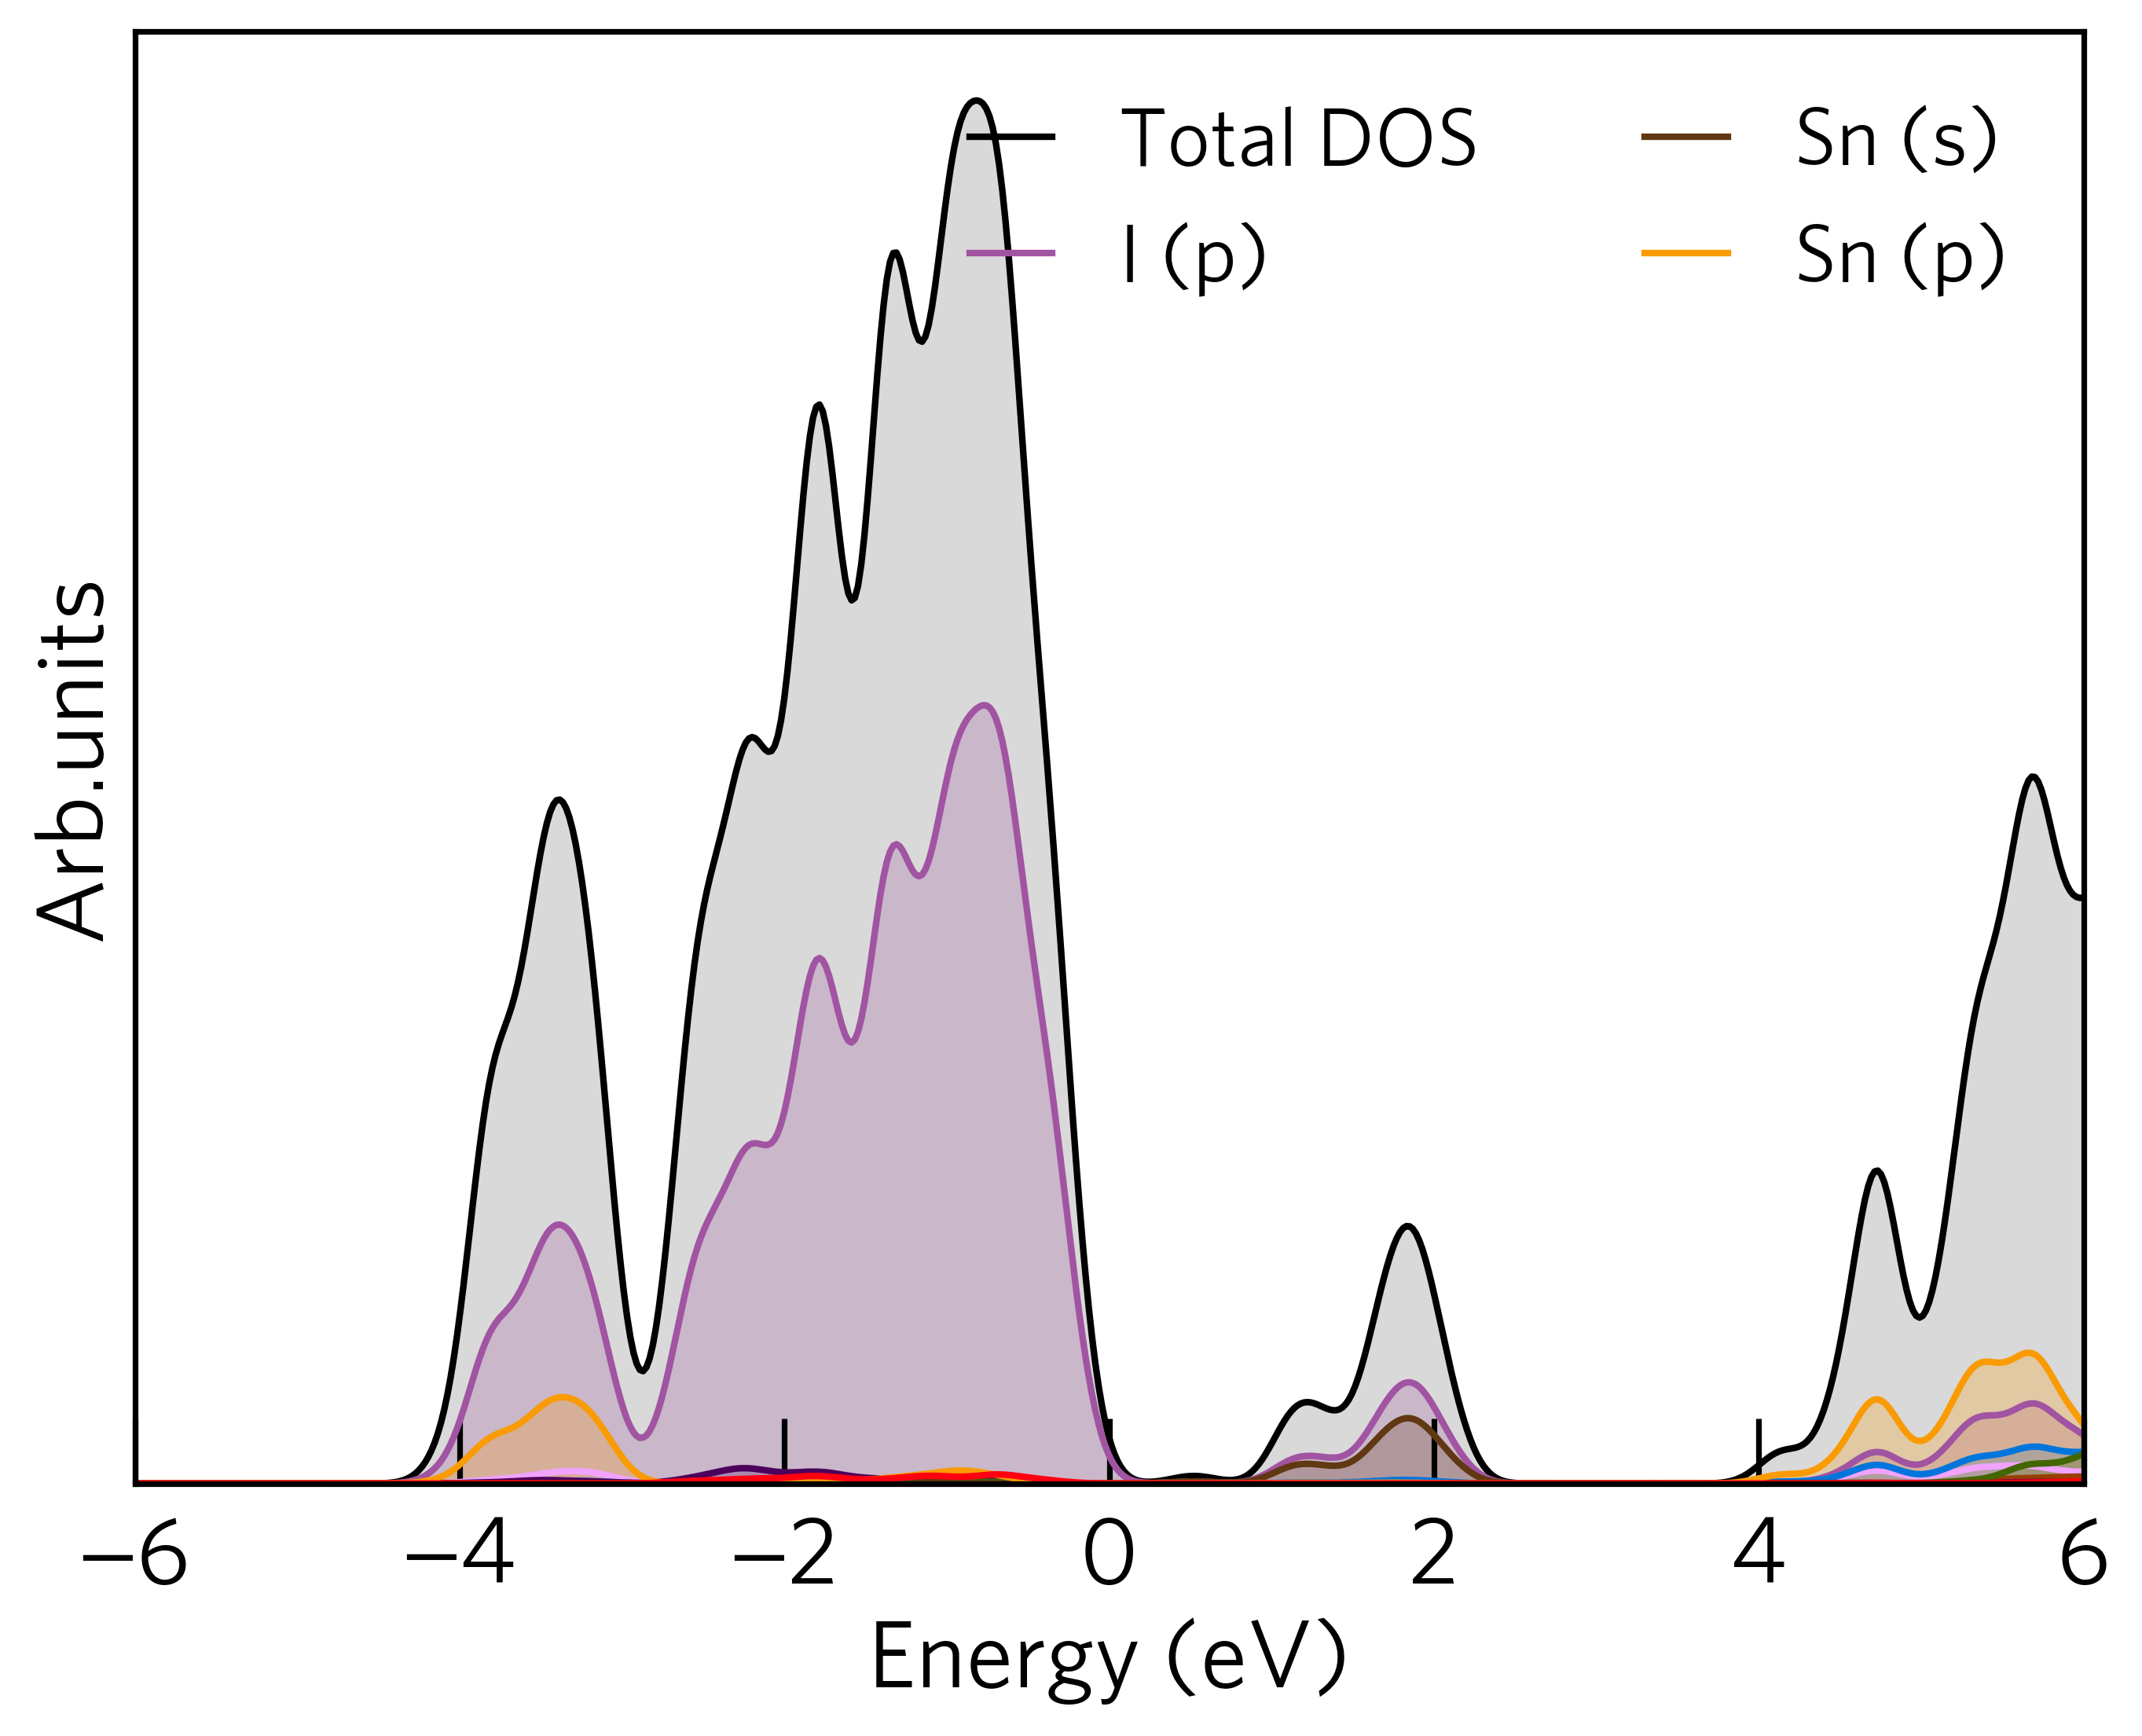
For example, if we run the command in the sumo/tests/data/Cs2SnI6/dos directory, the density of states will
look like:
Basic Options
The program automatically looks for files in the current directory, to specify alternative files, the
--filename option can be used.
The number of columns in the legend is controlled using the --columns option.
The height, and width of the graphic, along with the x-axis limits, can be controlled via the
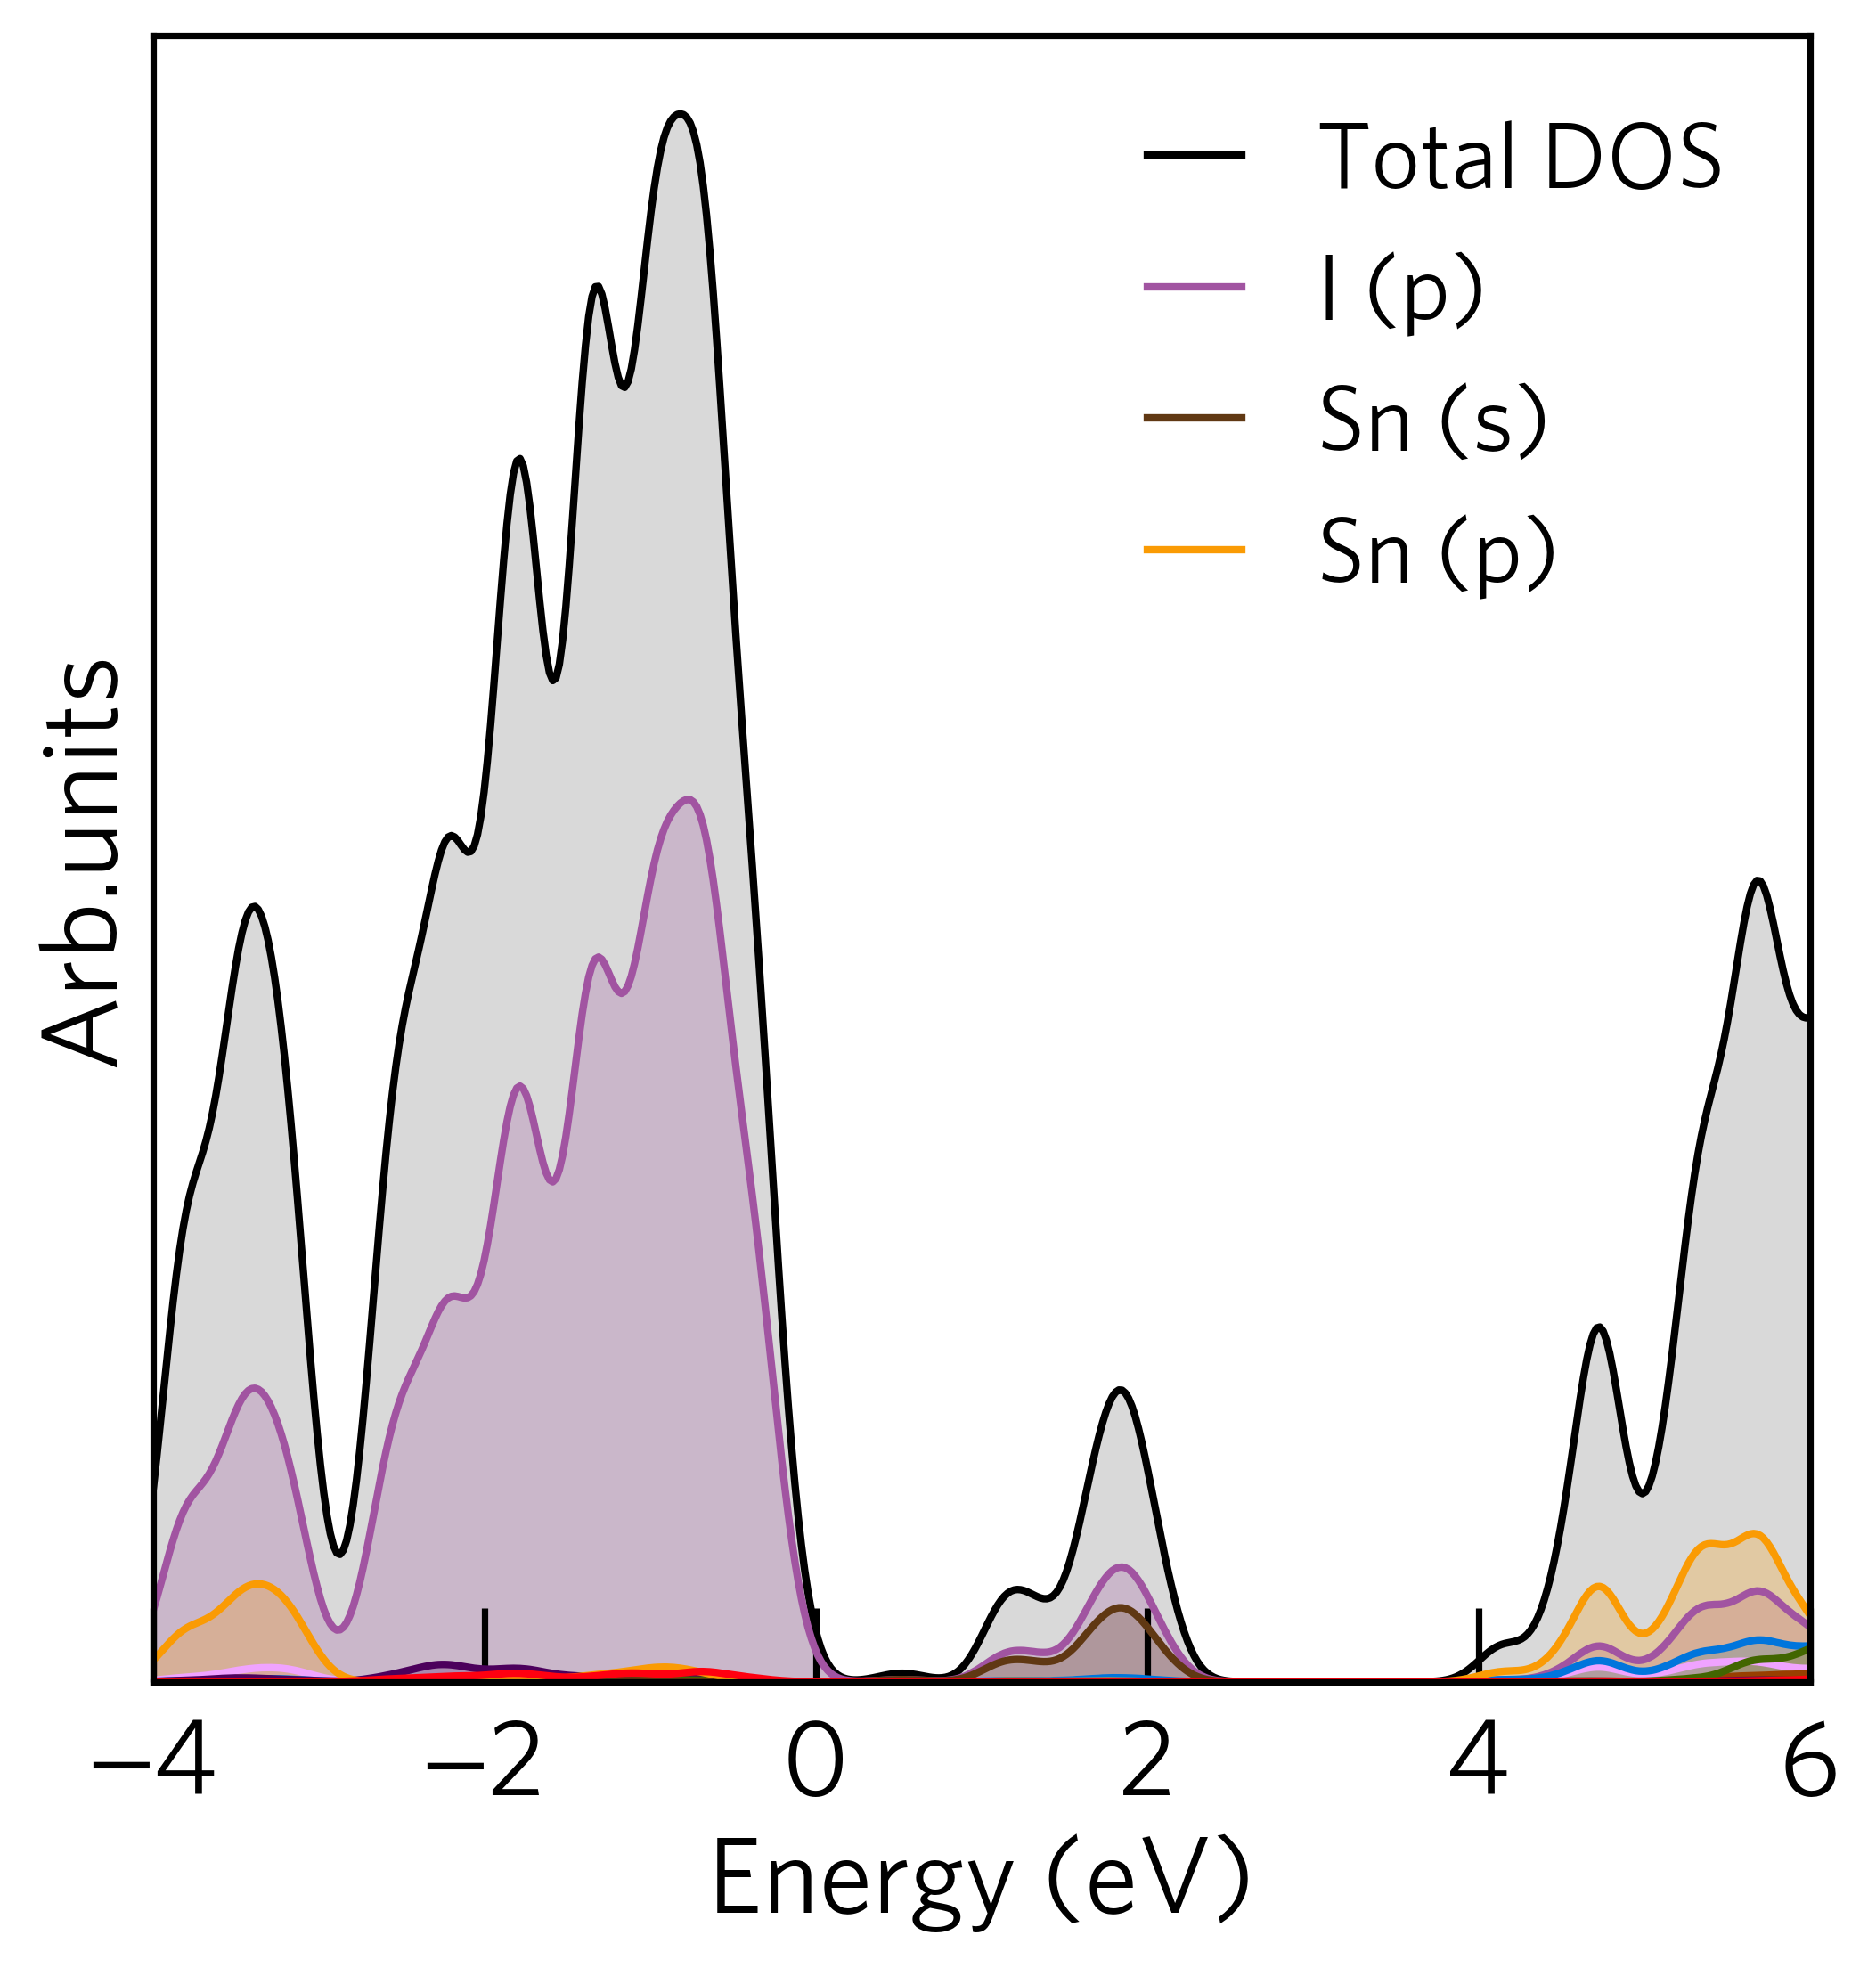
--width, --height, --xmax, and --xmin options. For example, the plot above could be
made more appealing using the following command:
sumo-dosplot --width 6 --height 6 --xmin -4 --xmax 6 --columns 1
Additional gaussian broadening can be applied using the --gaussian option. The setting expects a floating
point number as the argument and controls the standard deviation of the broadening applied.
Subplots
sumo-dosplot supports plotting the total and elemental density of states on separate panels, or subplots,
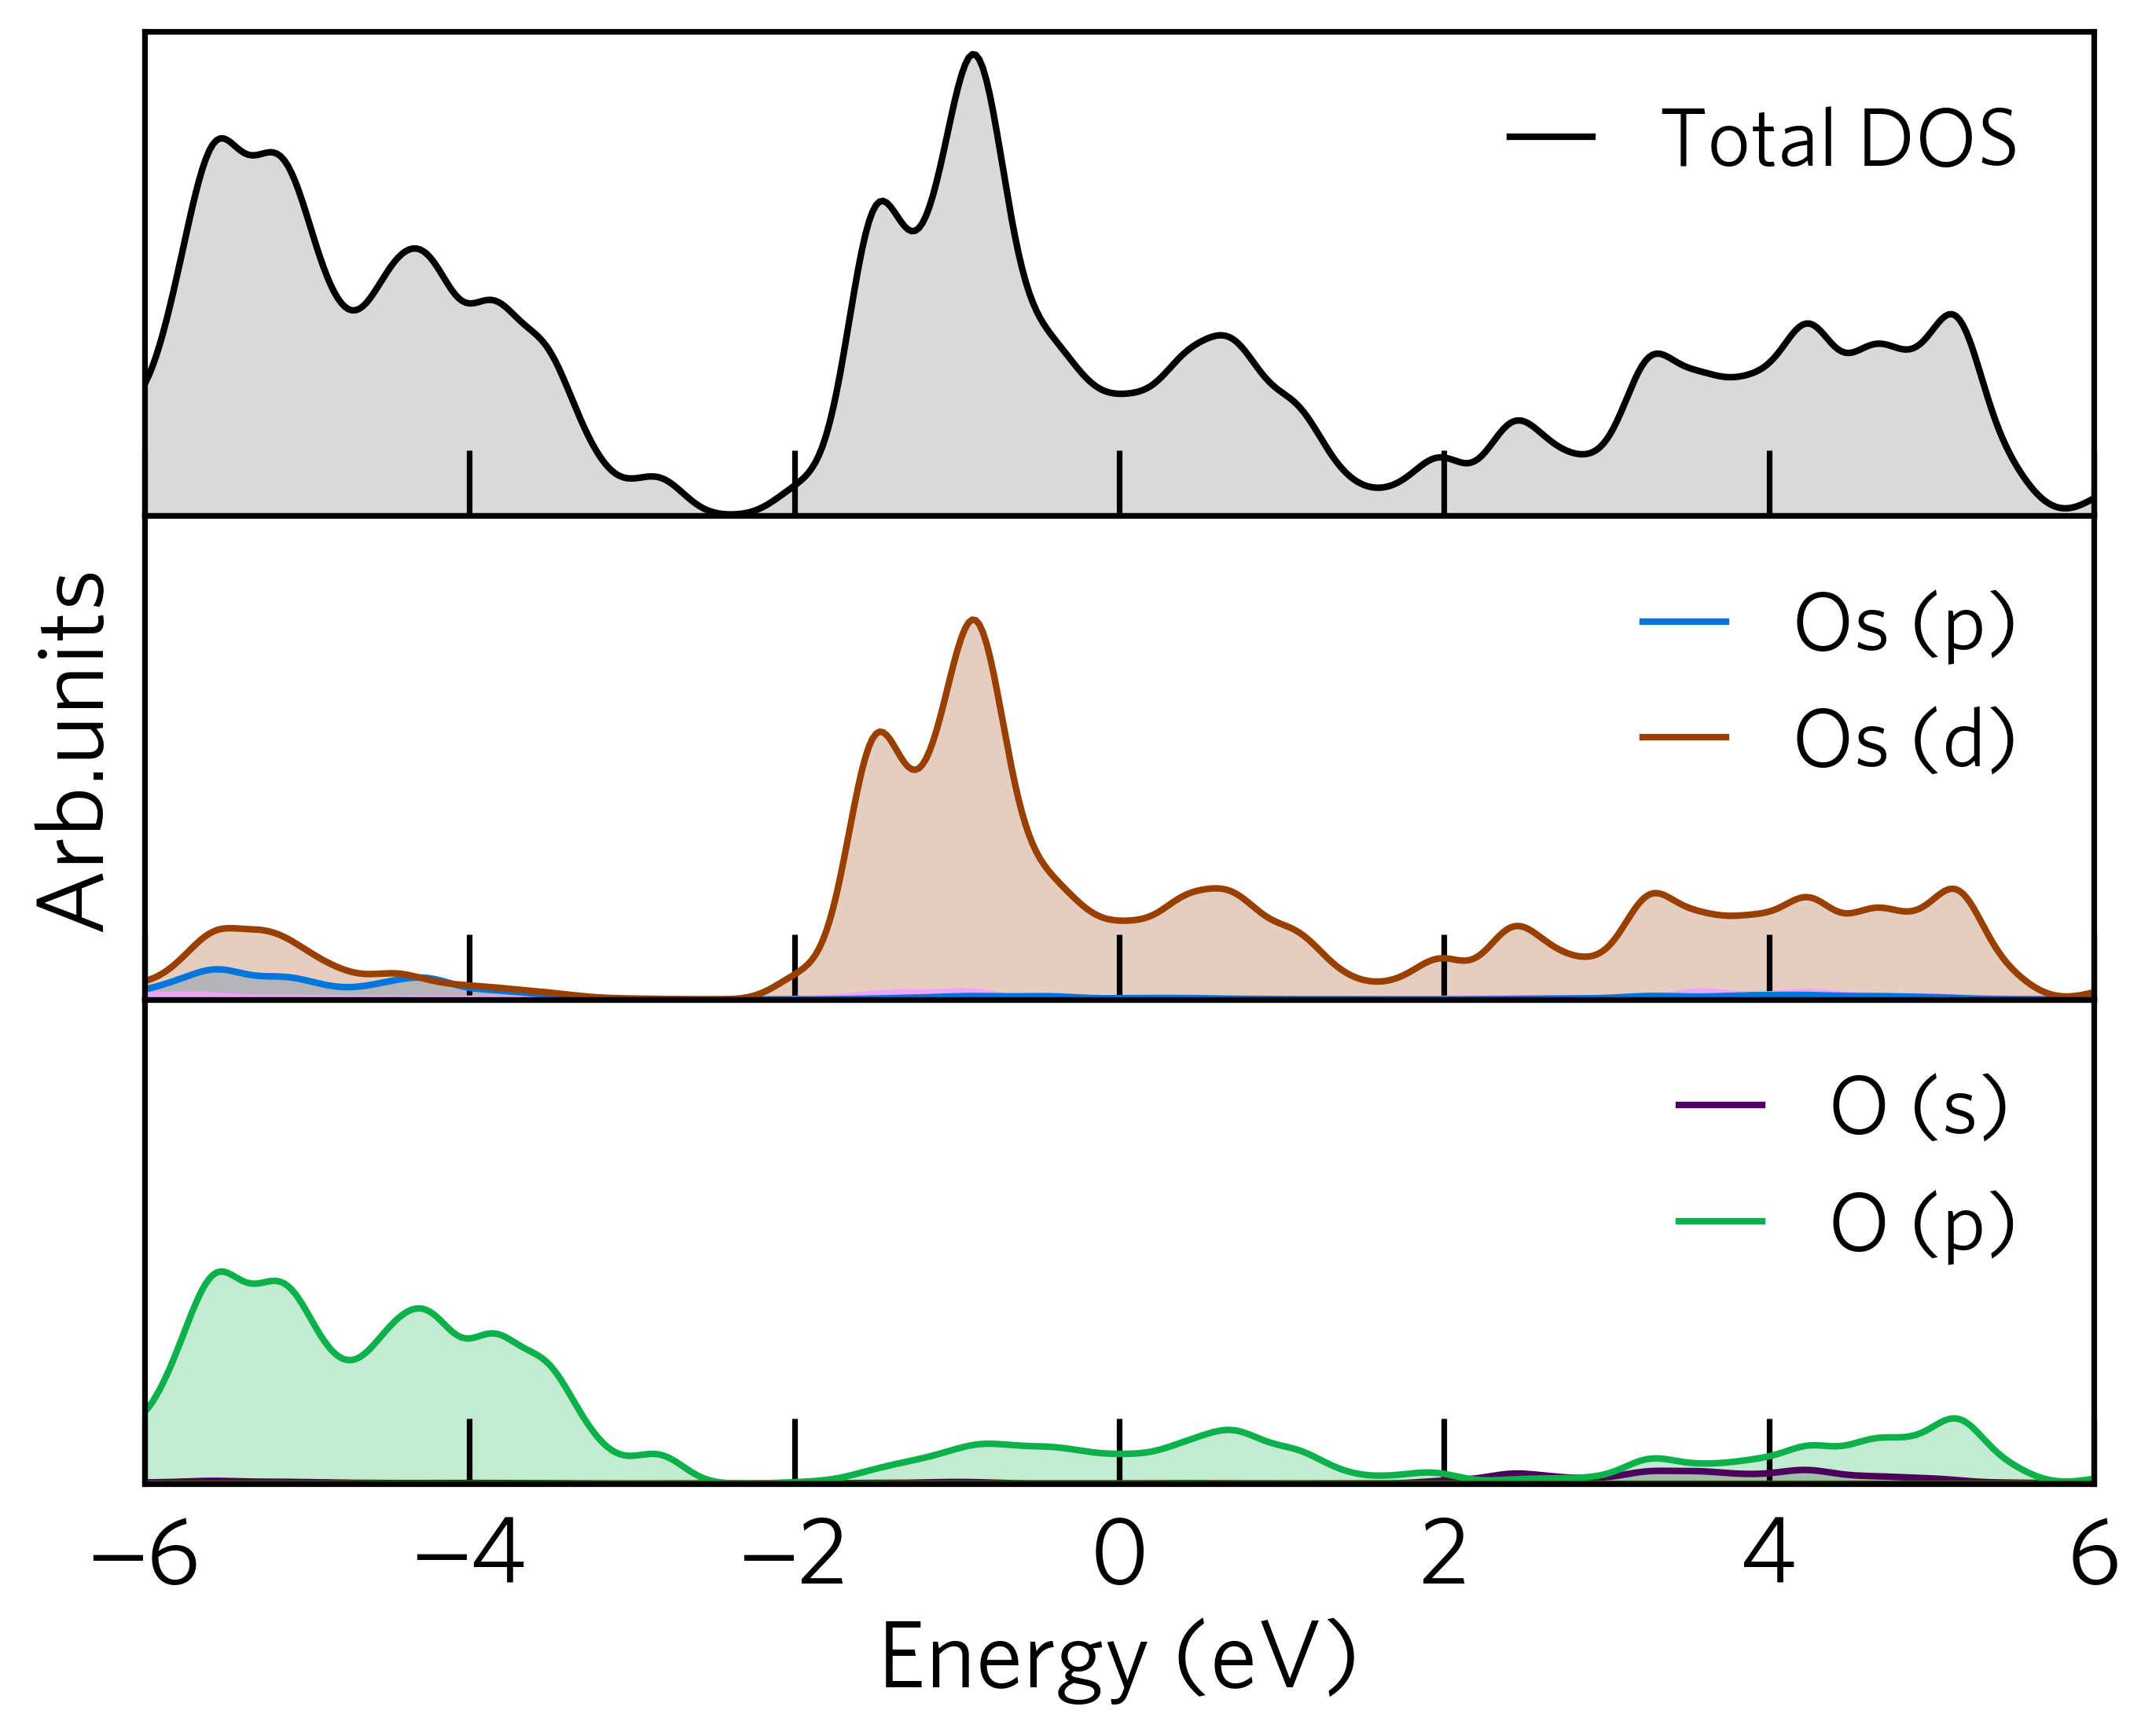
using the --subplot option. For example, if we run the following command in the
sumo/tests/data/OsO2 folder, the output will look like:
sumo-dosplot --subplot
Legend Labels
You may have noticed that not all elements and their orbitals are displayed in the legend. This is because
sumo-dosplot only labels states that have a significant contribution in the plotting area. By default,
a significant contribution is defined as greater than 3 % of the max total density of states. The
number of labels present in the legend can be controlled via the --legend-cutoff option, which controls
the cutoff in %, at which a label is given to an orbital.
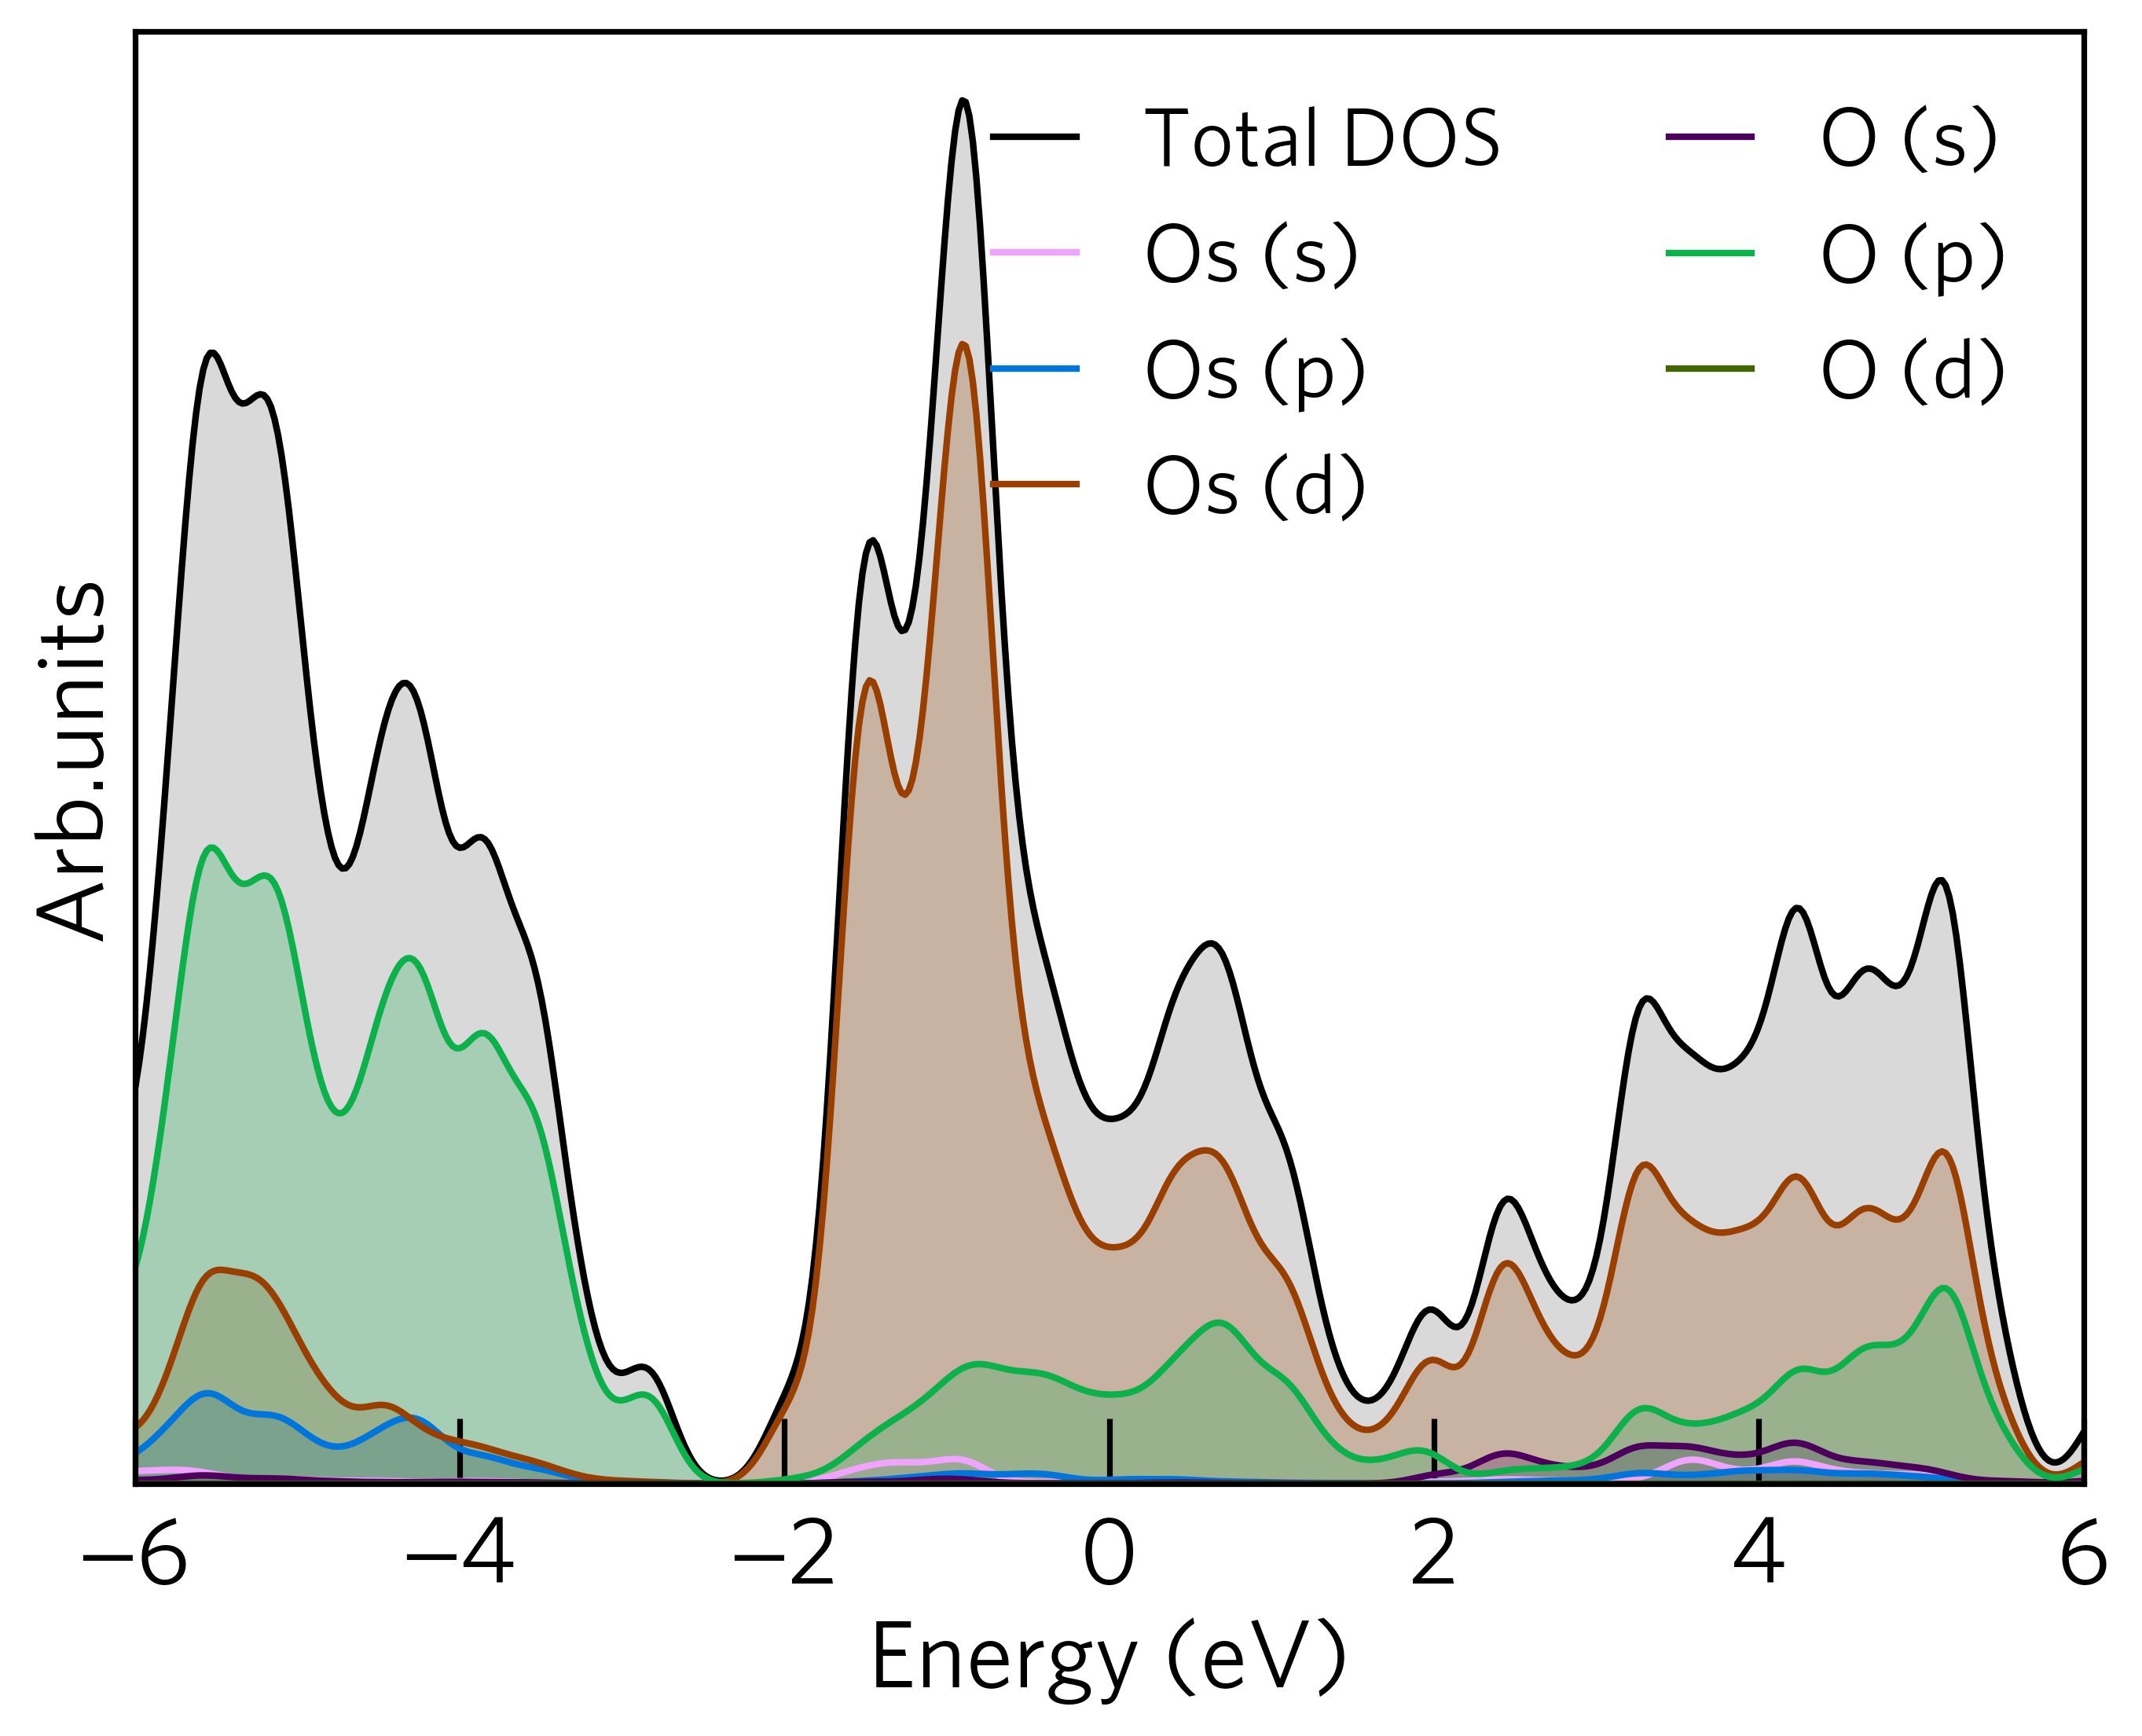
For example, if we wish to give all orbitals a label, simply set the cutoff to 0
For example:
sumo-dosplot --legend-cutoff 0
Will give a density of states that looks like:
Selective Plotting of Specific Orbitals and Atoms
By default sumo-dosplot includes all elements, orbitals, and atoms when plotting the density of states.
However, sometimes it may be desirable to plot the density of states of only of a specific orbital,
or even specific atoms.
Selecting Elements
The --elements option controls which elemental orbitals are included in the plot.
The syntax for specifying which elemental orbitals to include is as follows:
Elements are identified using their symbol from the
POSCARMultiple elements are separated via commas.
Specific orbitals can be chosen by adding the orbital after the element using a period as a separator.
If no orbitals are specified but the atomic symbol is included, then all orbitals of that element will be plotted.
For example, to plot the Os s and d and all O orbitals, the command would be:
sumo-dosplot --elements Os.s.d,O
Selecting Atoms
The --atoms option controls which atoms are included in the plot.
The syntax for specifying which atoms to include is as follows:
Elements are identified using their symbol from the
POSCARMultiple elements are separated via commas.
Specific atoms can be chosen by adding the atomic index after the element using a period as a separator.
Atomic indexes begin at 1 for each species in the structure.
If no atoms are specified but the atomic symbol is included, then all atoms of that element will be plotted.
For example, to plot the second Os atom and the first two O atoms, the command would be:
sumo-dosplot --atoms Os.2,O.1.2
lm-Decomposed Orbitals
By default all lm-decomposed orbitals (e.g. px, py, and pz) are summed into a single orbital contribution
(e.g. p). The --orbitals option can be used to plot the individual lm-decomposed contributions.
Please note that the structure should be correctly oriented in cartesian space if the orbitals are to have
any physical meaning. If you are unsure what this means, then you probably shouldn’t use this option.
The syntax for specifying which orbitals to split into their lm contributions is as follows:
Elements are identified using their symbol from the
POSCARMultiple elements are separated via commas.
Specific orbitals can be chosen by adding the orbital after the element using a period as a separator.
If no orbitals are specified but the atomic symbol is included, then all orbitals of that element will be split.
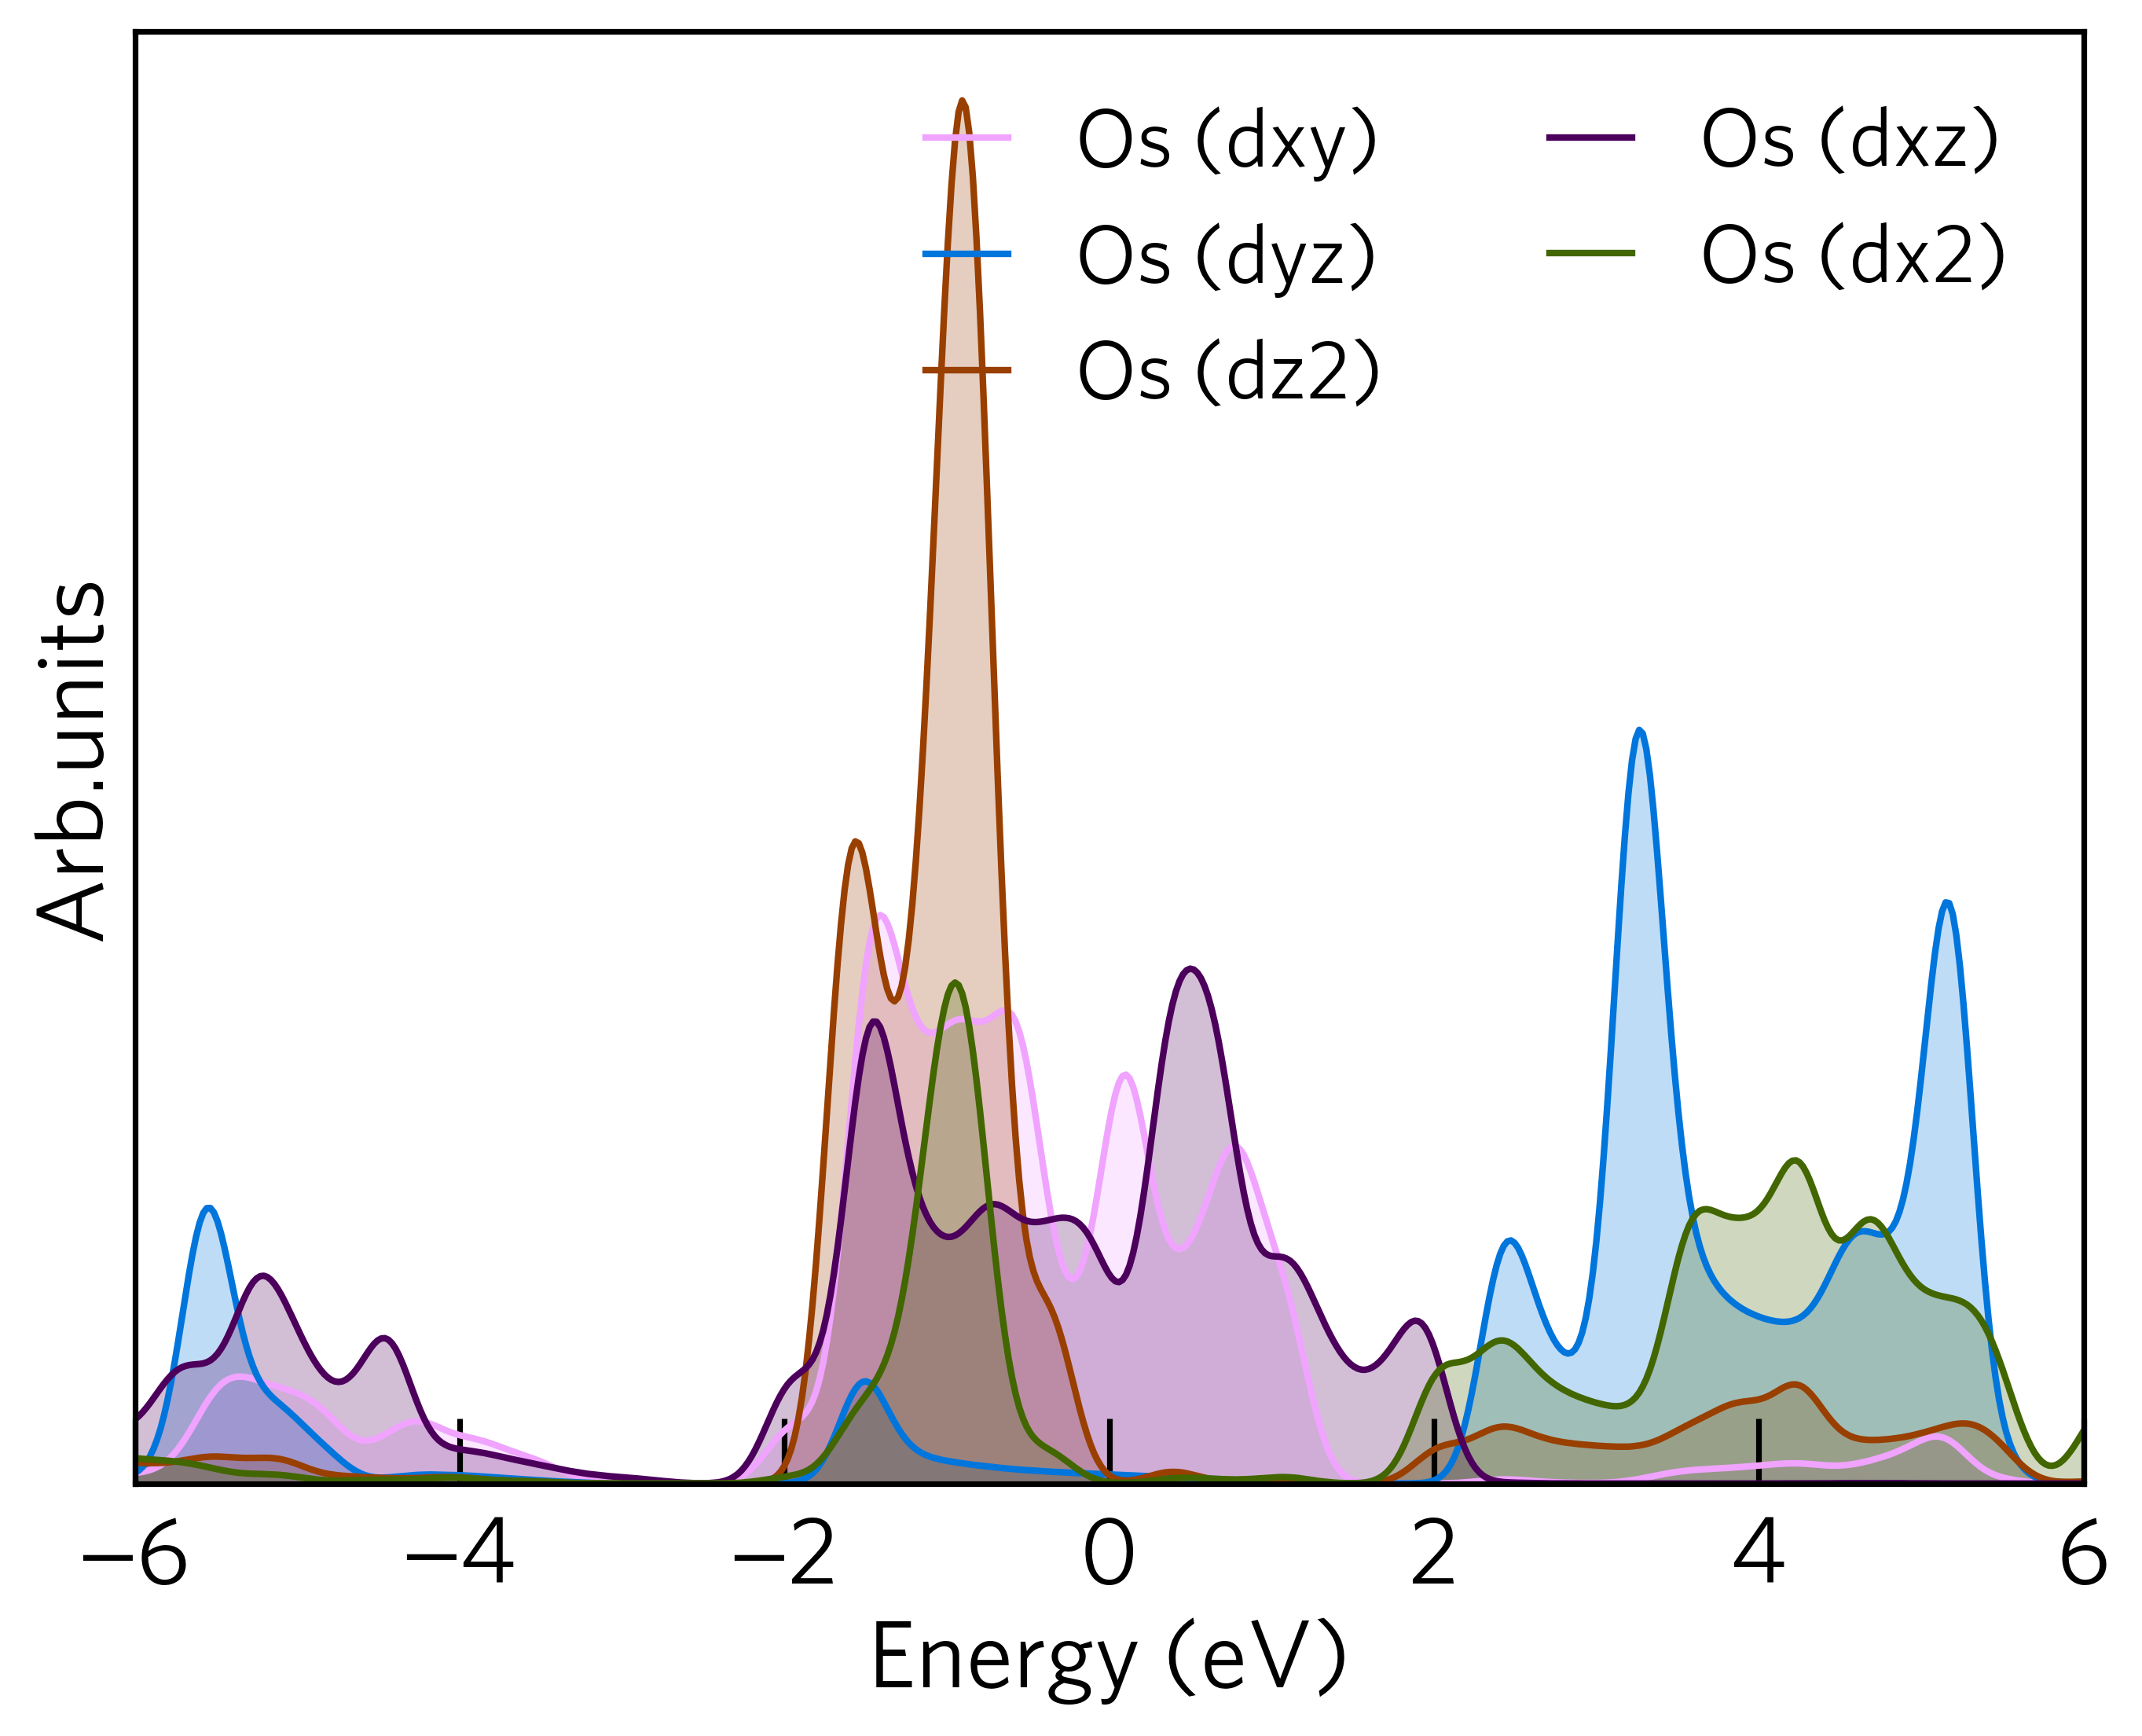
For example, to split the Os d orbitals, the command would be:
sumo-dosplot --orbitals Os.d
All the above options can be used simultaneously. For example, plot the lm-decomposed d orbitals for the first Os atom, the following command would be used:
sumo-dosplot --orbitals Os.d --elements Os.d --atoms Os.1 --no-total
The resulting plot looks like:
Custom Line Colours
Sumo uses a config file for choosing the colours of elements and orbitals in density of states plots.
The default colours can be found in sumo/conf/orbital_colours.conf. The format of this file is simple:
[N]
s = r
p = #D93B2B
The element is specified in square brackets, with the orbitals and their colours listed beneath. The supported colour identifiers include hex codes, rgb values or any other format supported by matplotlib.
To use your own custom colours, simply create your own config file in the current directory (e.g. my_colours.conf) and use the --config option to read in your settings. For example:
sumo-dosplot --config my_colours.conf
Questaal
A typical workflow for plotting the DOS in Questaal is to first converge a density with LMF, then run a non-self-consistent step to output DOS files with a command such as:
lmf ctrl.ext --dos:npts=2001:window=-1,1 --pdos --quit=rho
Setting –pdos defaults to mode 2, decomposing the DOS contributions by l, m and each structure site. However, that decomposed data is written in a binary format to moms.ext while dos.ext contains a total-DOS. This will be overwritten in the next step, so for usage with Sumo please rename this file to “tdos.ext”:
mv dos.ext tdos.ext
Part of Questaal, the lmdos program converts from moms.ext to a plottable PDOS. It needs to run with the same –dos and –pdos flags as the previous step, i.e. in this case:
lmdos --dos:npts=2001:window=-1,1 --pdos ext
This generates a new dos.ext containing pdos data and replacing the existing file if present.
To plot with Sumo, provide either file. If a single-channel file is provided, Sumo will plot a TDOS, e.g.:
sumo-dosplot --code questaal -f tdos.ext
If a multichannel PDOS file is provided, this will be interpreted as if decomposed by site, l, and m. The site.ext file is read in, and if present a file named tdos.ext will also be used to add the total DOS.:
sumo-dosplot --code questaal -f dos.ext
The –elements and –orbitals options may be used to specify which channels are grouped and/or shown. Note that empty sites may be included in the output if they have a non-negligible contribution to the DOS. The –elements switch may be useful for hiding these if desired.
Castep
When plotting from CASTEP, give the seedname.bands path as –filename. If a .pdos_bin file is in the same directory, orbital-project DOS plots are possible; this requires the .cell file to also be available. Otherwise, a total DOS will be obtained by summing over the eigenvalue data in the .bands file.
Command-Line Interface
dosplot is a script to produce publication-ready density of states diagrams
usage: sumo-dosplot [-h] [-f F] [-c C] [-p P] [-d D] [-e E] [-o O] [-a A]
                    [--spin SPIN] [-s] [-g G] [--columns N]
                    [--legend-cutoff C] [--no-legend] [--legend-frame]
                    [--no-shift | --zero-energy ZERO_ENERGY] [--total-only]
                    [--no-total] [--height HEIGHT] [--width WIDTH]
                    [--xmin XMIN] [--xmax XMAX] [--config CONFIG]
                    [--style STYLE [STYLE ...]] [--no-base-style]
                    [--xlabel XLABEL] [--ylabel YLABEL] [--yscale YSCALE]
                    [--zero-line] [--format FORMAT] [--dpi DPI] [--font FONT]
Named Arguments
- -f, --filename
vasprun.xml file to plot
- -c, --code
Input file format: “vasp” (vasprun.xml) or “questaal” (opt.ext)
Default:
'vasp'- -p, --prefix
prefix for the files generated
- -d, --directory
output directory for files
- -e, --elements
elemental orbitals to plot (e.g. “C.s.p,O”)
- -o, --orbitals
orbitals to split into lm-decomposed contributions (e.g. ‘Ru.d’)
- -a, --atoms
atoms to include (e.g. “O.1.2.3,Ru.1.2.3”)
- --spin
select one spin channel only for a spin-polarised calculation (options: up, 1; down, -1)
- -s, --subplot
plot each element on separate subplots
Default:
False- -g, --gaussian
standard deviation of gaussian broadening
- --columns
number of columns in the legend
Default:
2- --legend-cutoff
cut-off in % of total DOS that determines if a line is given a label (default: 3)
Default:
3- --no-legend
hide the plot legend
Default:
True- --legend-frame
display a box around the legend
Default:
False- --no-shift
don’t shift the VBM/Fermi level to 0 eV
Default:
True- --zero-energy
Reference energy: energy will be shifted to place this energy at zero. If not specified (and –no-shift not used), zero will be set to the VBM.
- --total-only
only plot the total density of states
Default:
False- --no-total
don’t plot the total density of states
Default:
True- --height
height of the graph
- --width
width of the graph
- --xmin
minimum energy on the x-axis
Default:
-6.0- --xmax
maximum energy on the x-axis
Default:
6.0- --config
colour configuration file
- --style
matplotlib style specifications
- --no-base-style
prevent use of sumo base style
Default:
False- --xlabel
x-axis (i.e. energy) label/units
Default:
'Energy (eV)'- --ylabel
y-axis (i.e. DOS) label/units
Default:
'DOS'- --yscale
scaling factor for the y-axis
Default:
1- --zero-line
Plot vertical line at energy zero
Default:
False- --format
image file format (options: pdf, svg, jpg, png)
Default:
'pdf'- --dpi
pixel density for image file
Default:
400- --font
font to use
Author: Alex Ganose Version: 1.0 Last updated: April 9, 2018