sumo-optplot
sumo-optplot is a program for generating publication-ready optical absorption
spectra diagrams from VASP calculations. The script supports plotting multiple
spectra simultaneously.
Usage
The full range of options supported by sumo-optplot are detailed in the Command-Line Interface section,
and be can be accessed using the command:
sumo-optplot -h
To plot an absorption spectra, simply run the following command in a folder containing a vasprun.xml or
vasprun.xml.gz file, which has been calculated using LOPTICS = .TRUE.:
sumo-optplot
The plot will be written to a file named absorption.pdf, with the raw data written to absorption.dat.
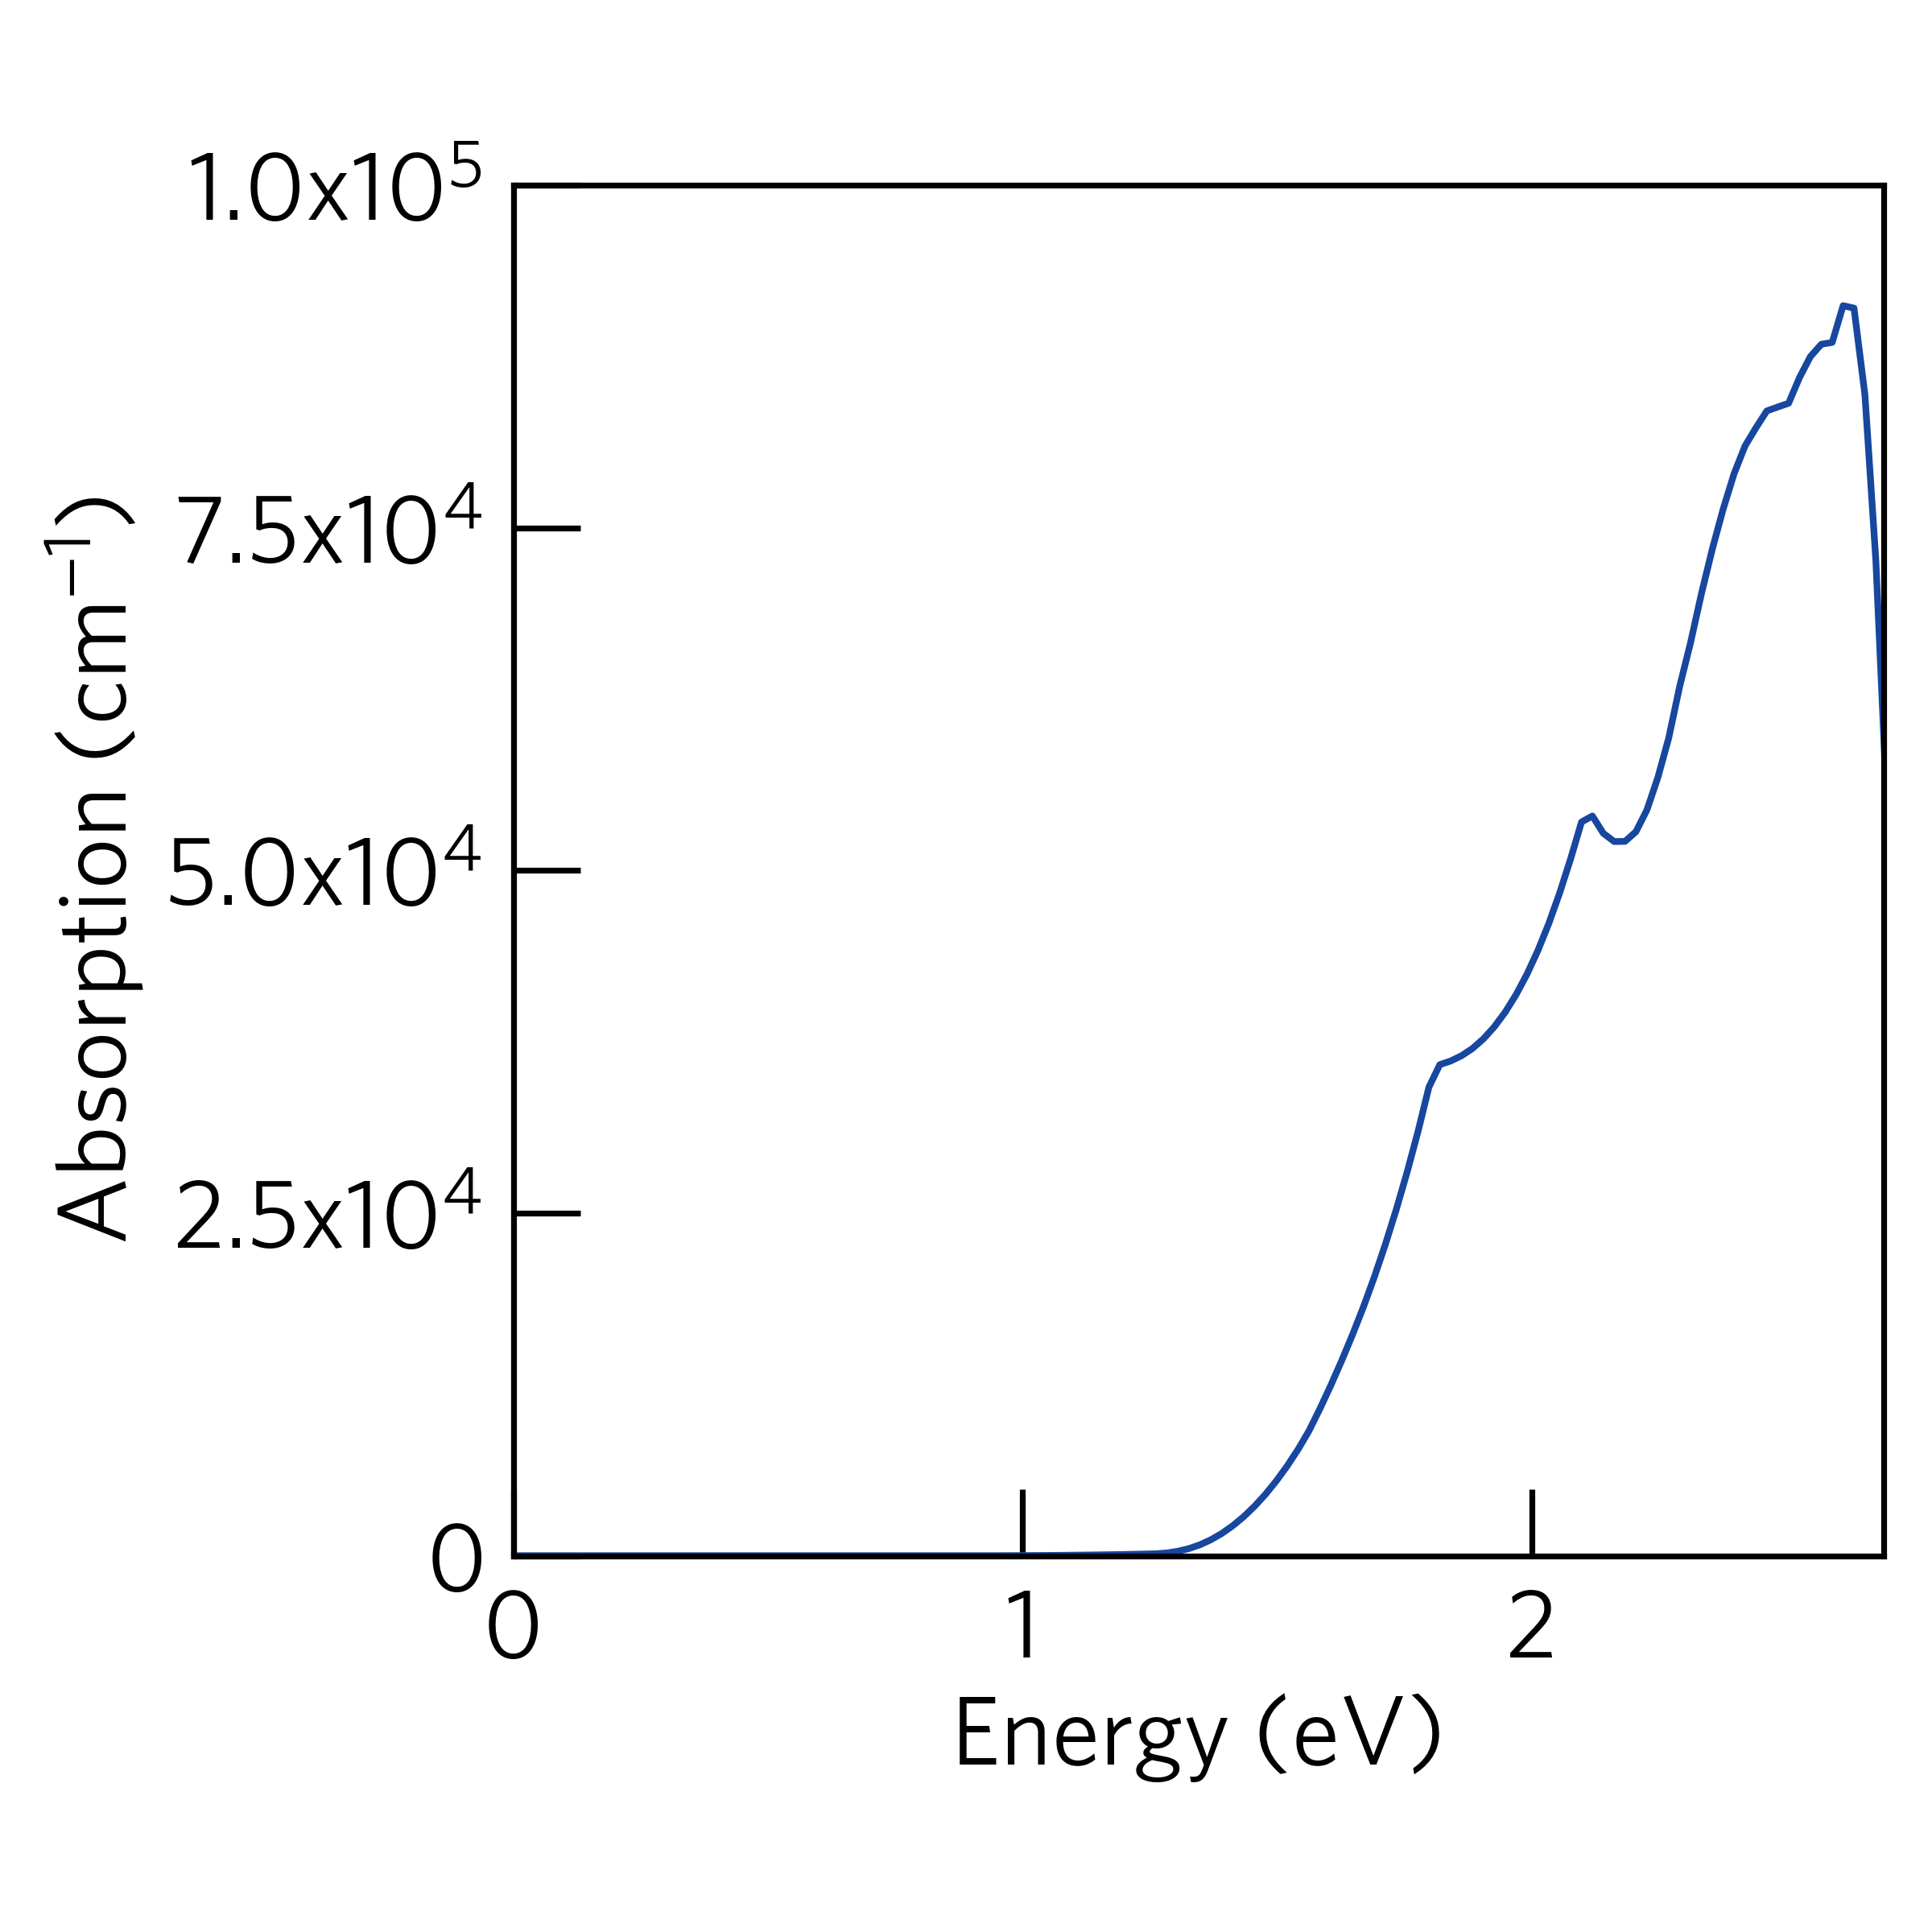
For example, if we run the command in the sumo/tests/data/Cs2SnI6/optics directory, the absorption
spectra should look like:
Basic Options
sumo-optplot automatically searches for a vasprun.xml file in the current directory.
To specify a particular vasprun.xml to plot, the --filenames option can be used.
The height, and width of the graphic, along with the y-axis limits, can be controlled via the
--width, --height, --ymax, and --ymin options.
Additional gaussian broadening can be applied using the --gaussian option. The setting expects a floating
point number as the argument and controls the standard deviation of the broadening applied.
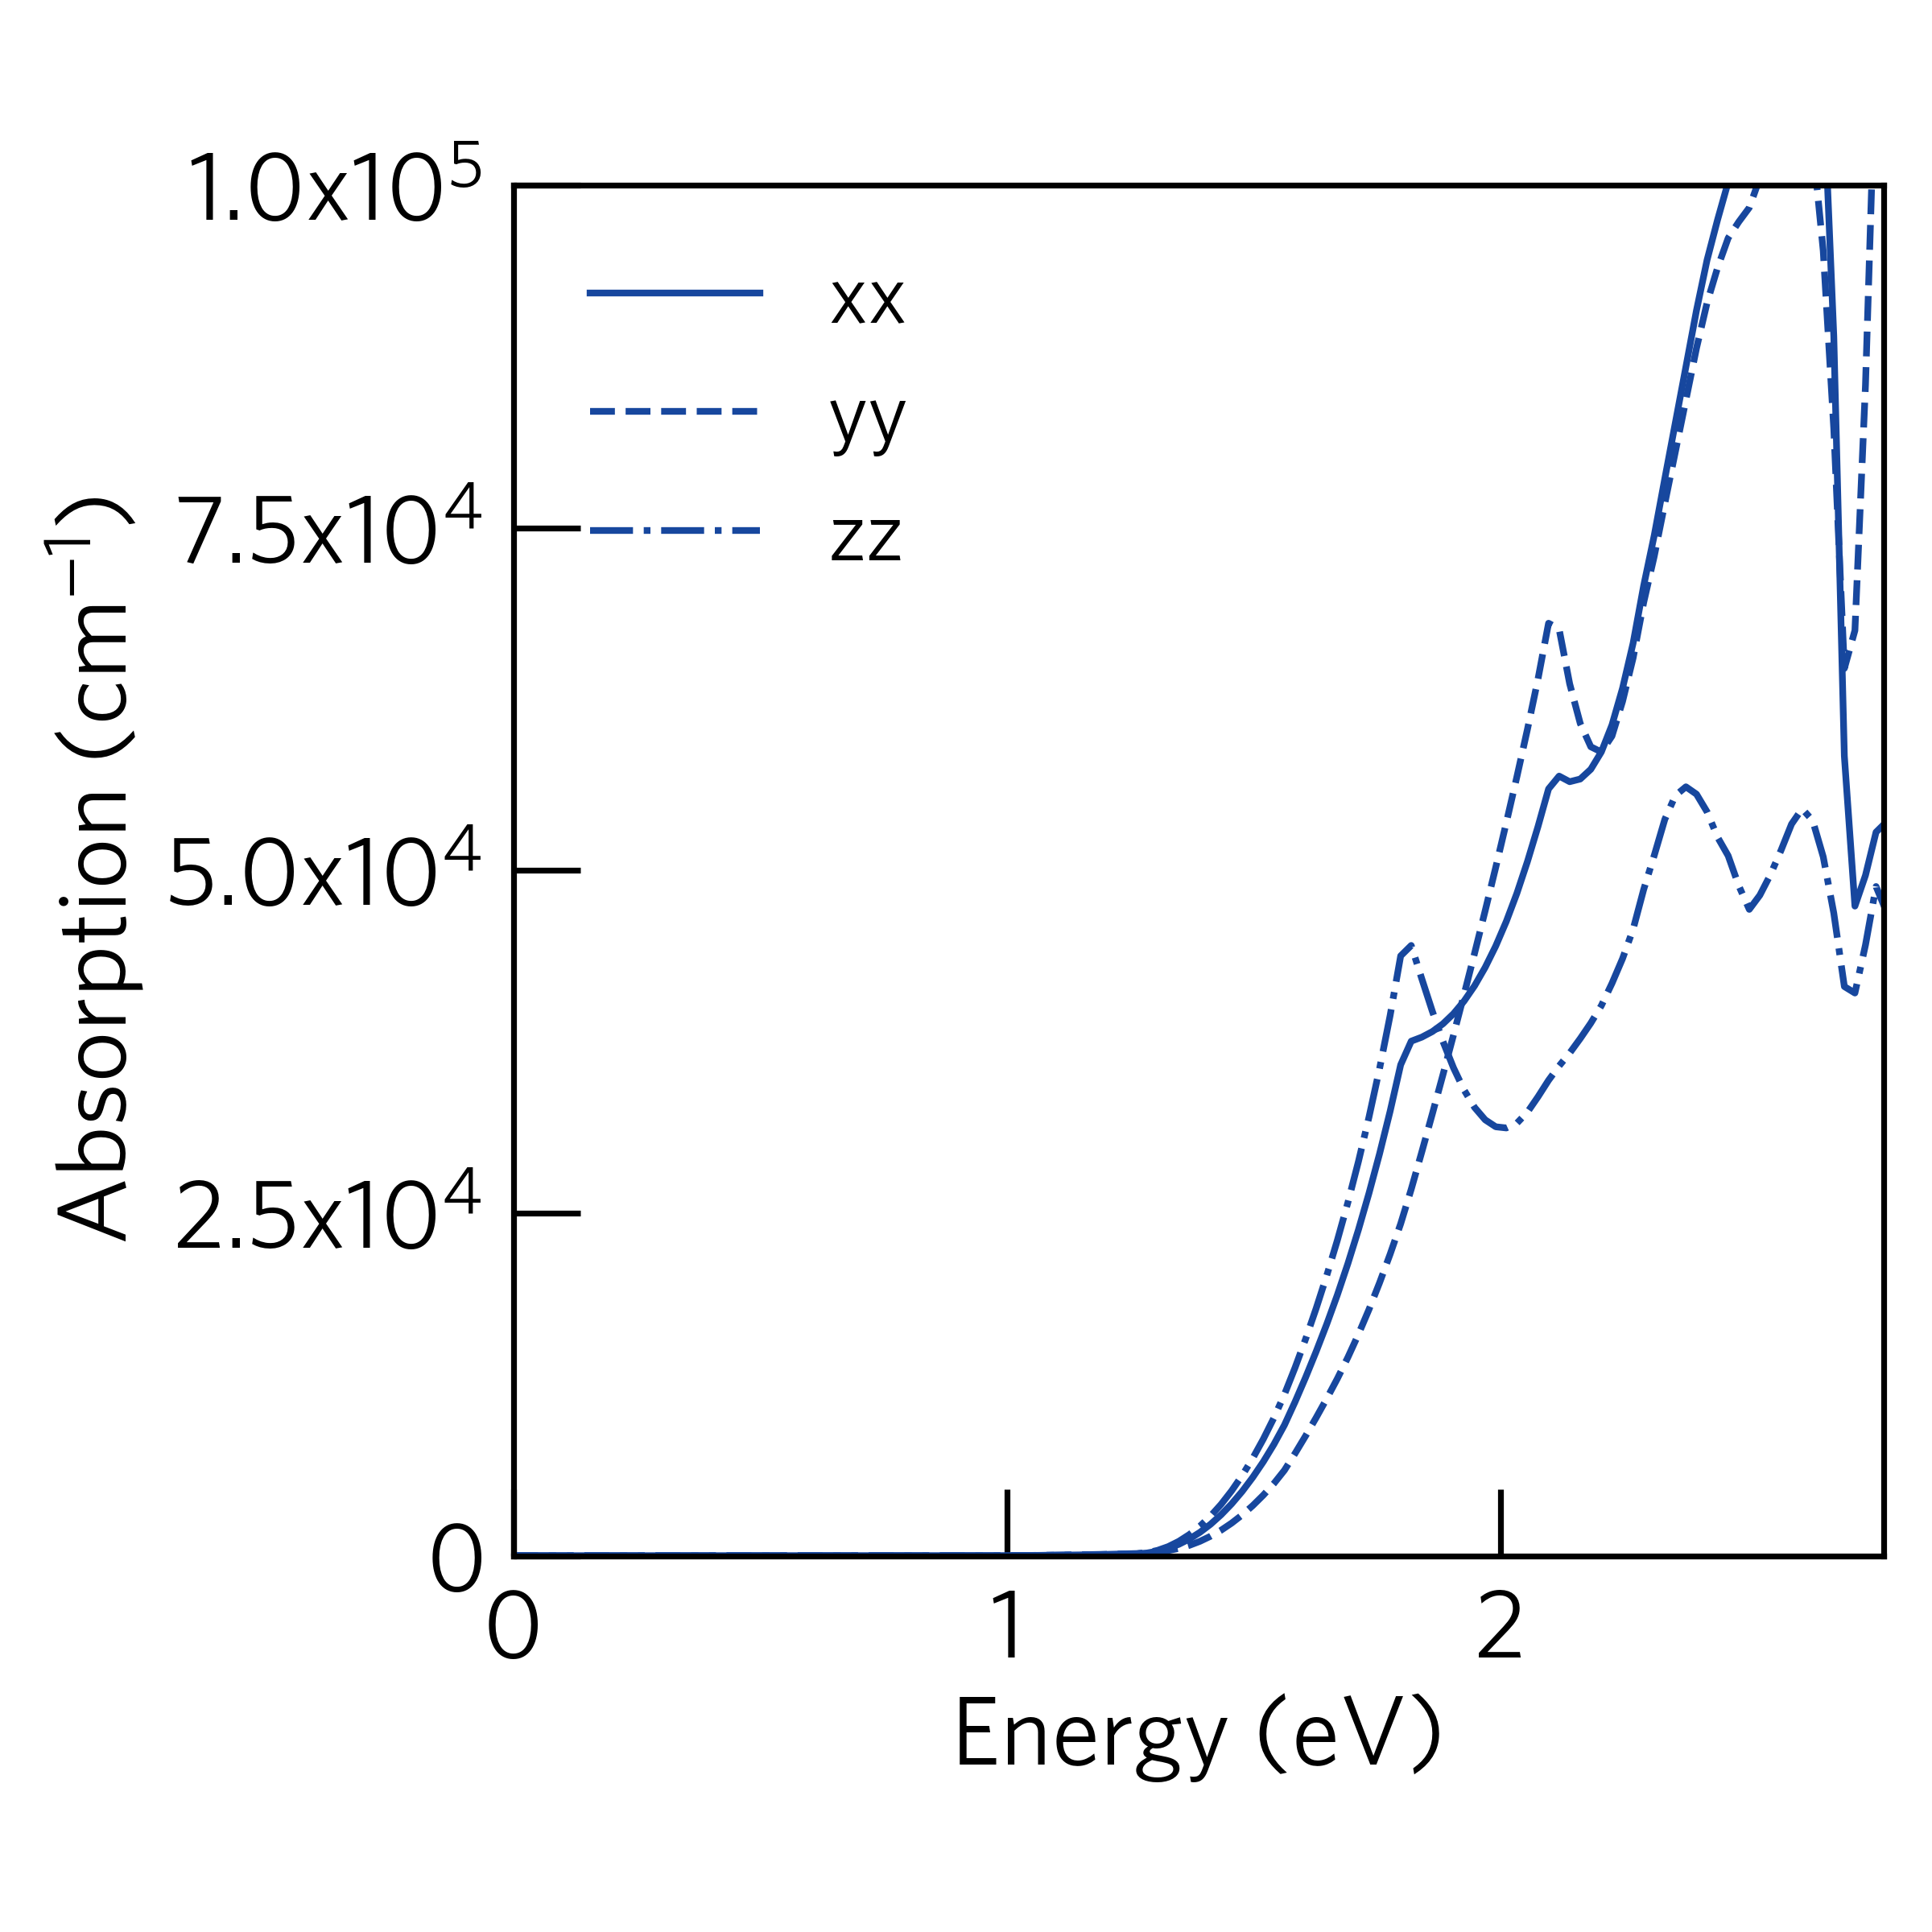
Anisotropic Absorption
By default, sumo-optplot plots the average optical absorption. The anisotropic contributions
from the x, y and z cartesian directions can be plotted individually using the --anisotropic
option.
For example, if we run the following command in the sumo/tests/data/Cs2SnI6/optics directory,
the anisotropic absorption spectra should look like:
sumo-optplot --anisotropic
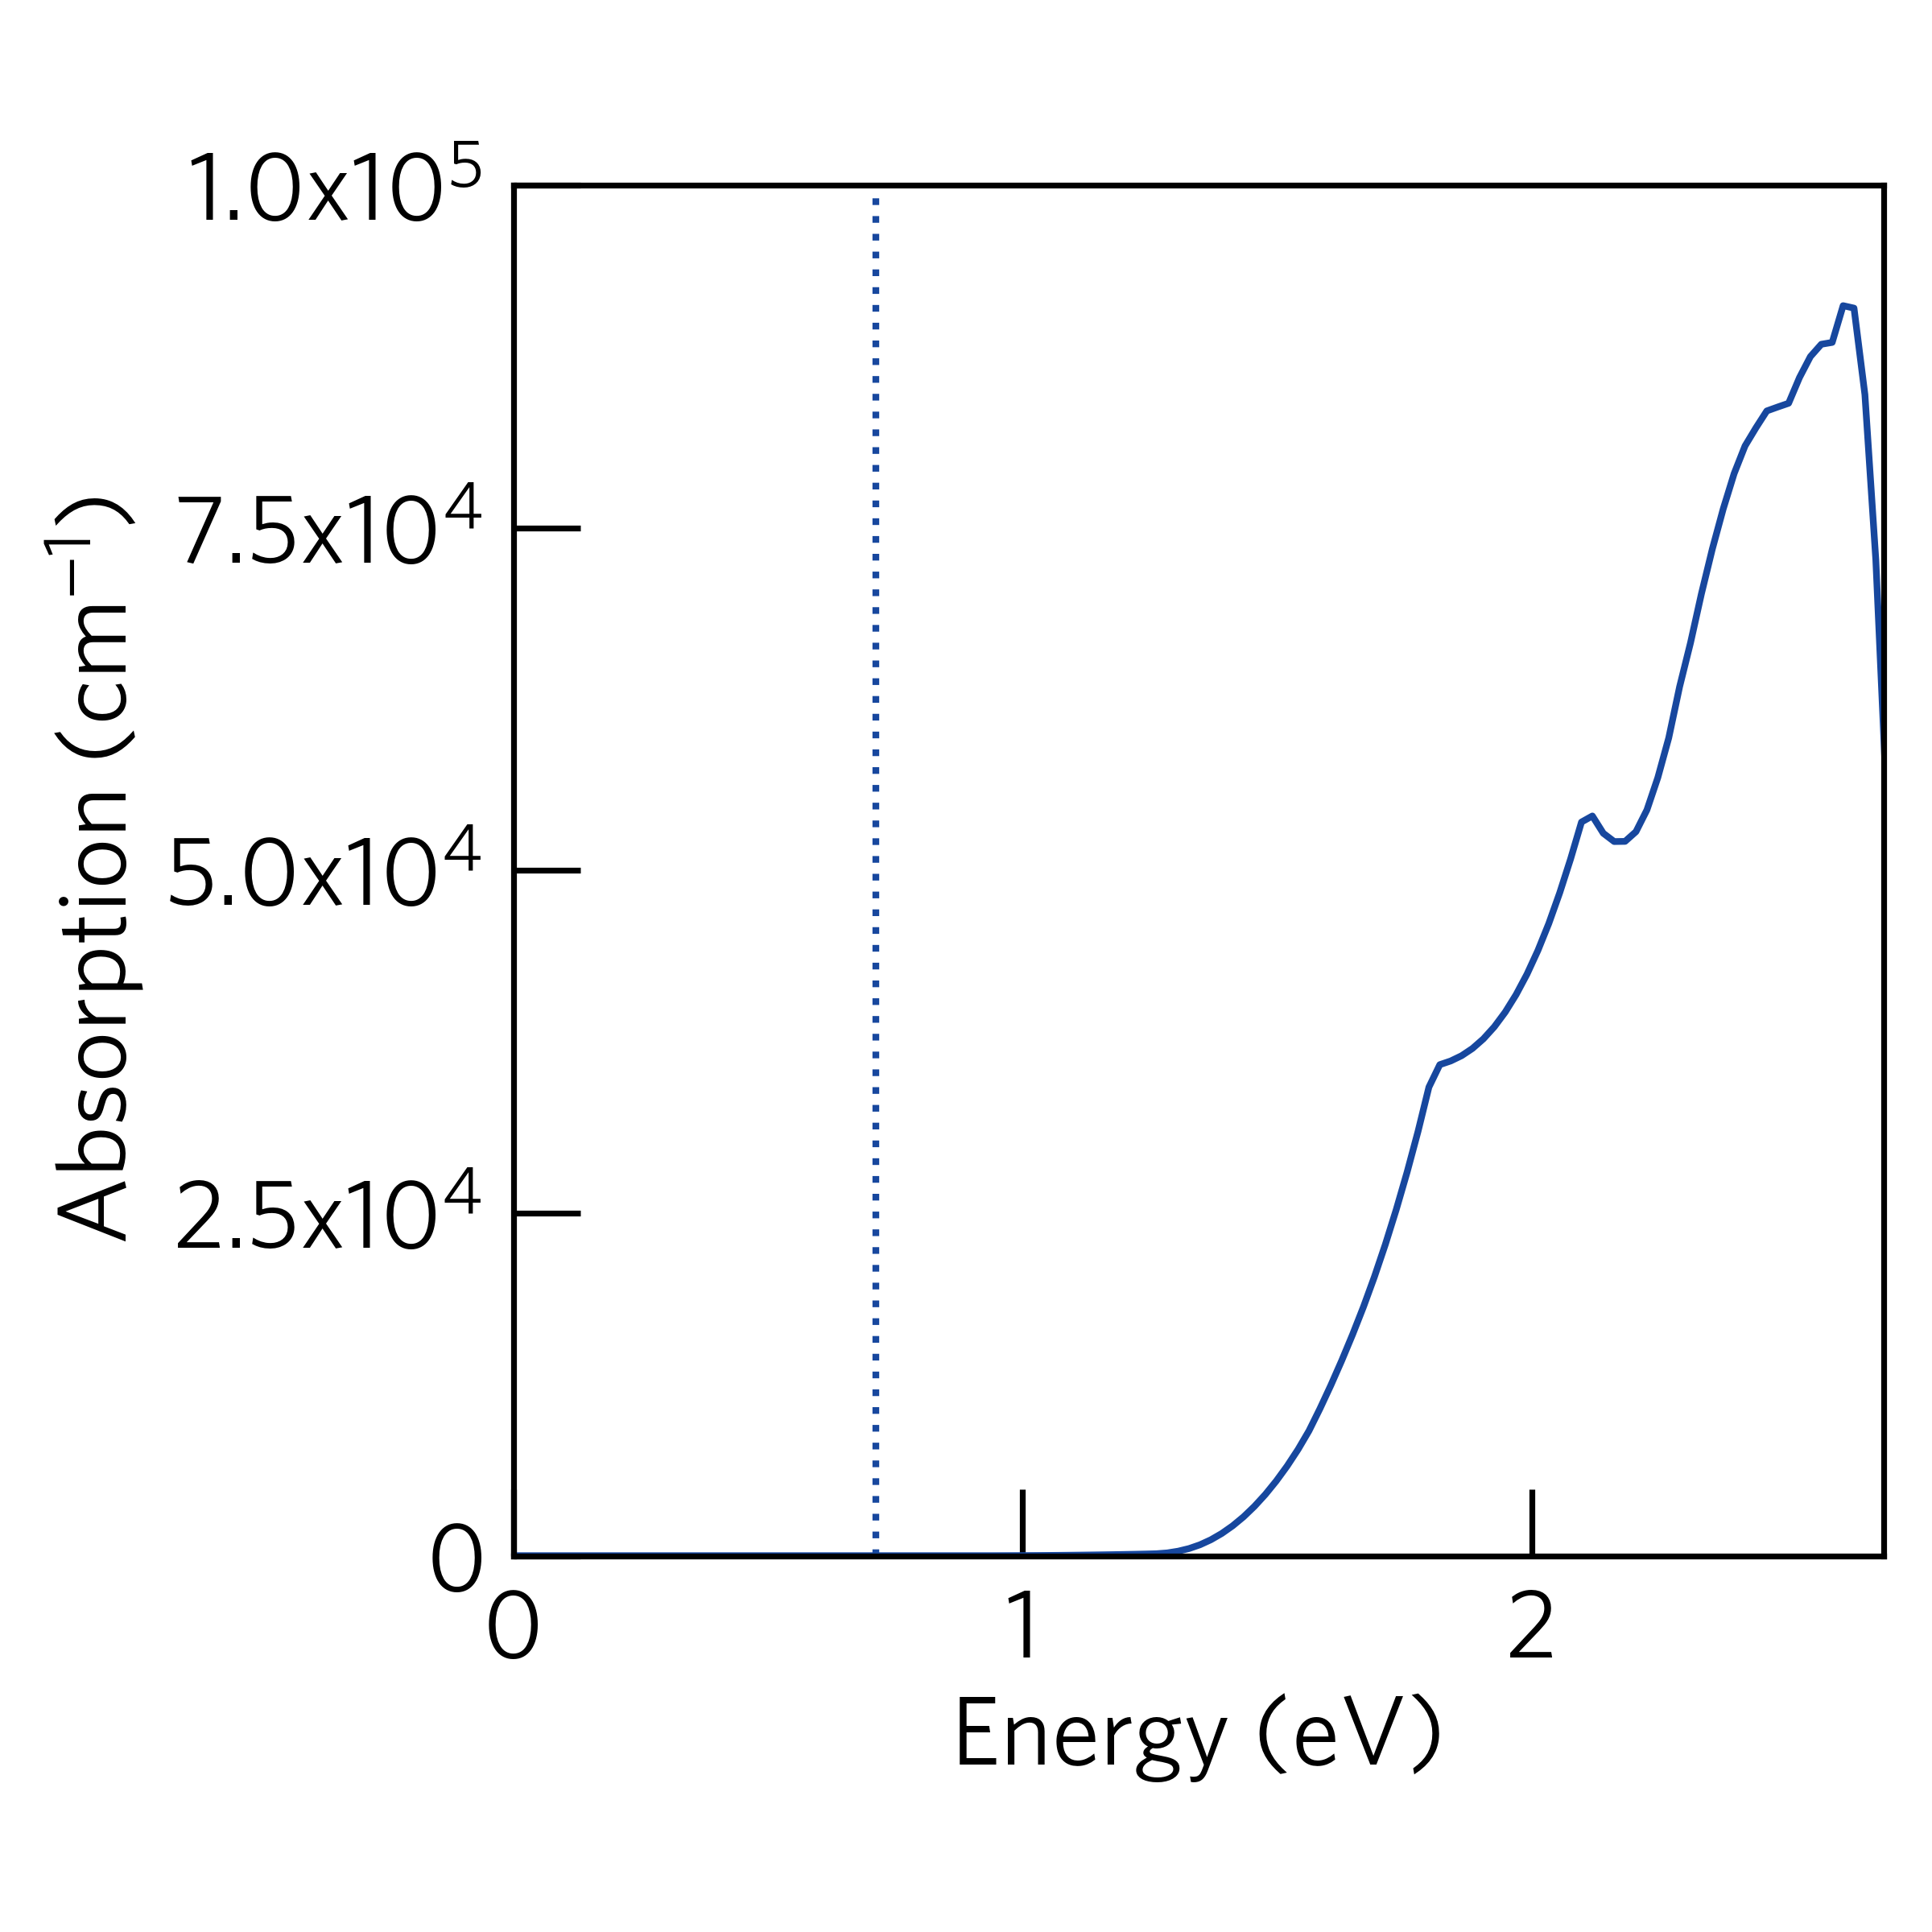
Displaying Band Gaps
The band gap of the system can be indicated using the --bandgap option.
There are several ways to use this option:
If the option is given with no arguments, then the band gap will be extracted from the
vasprun.xmlfile.A path to a separate
vasprun.xmlfile can be supplied, in which case the band gap will be read from this calculation.A number can be supplied.
For example, if we run the following command in the sumo/tests/data/Cs2SnI6/optics directory,
the plot should look like:
sumo-optplot --bandgap ../bandstructure/split-01/vasprun.xml.gz
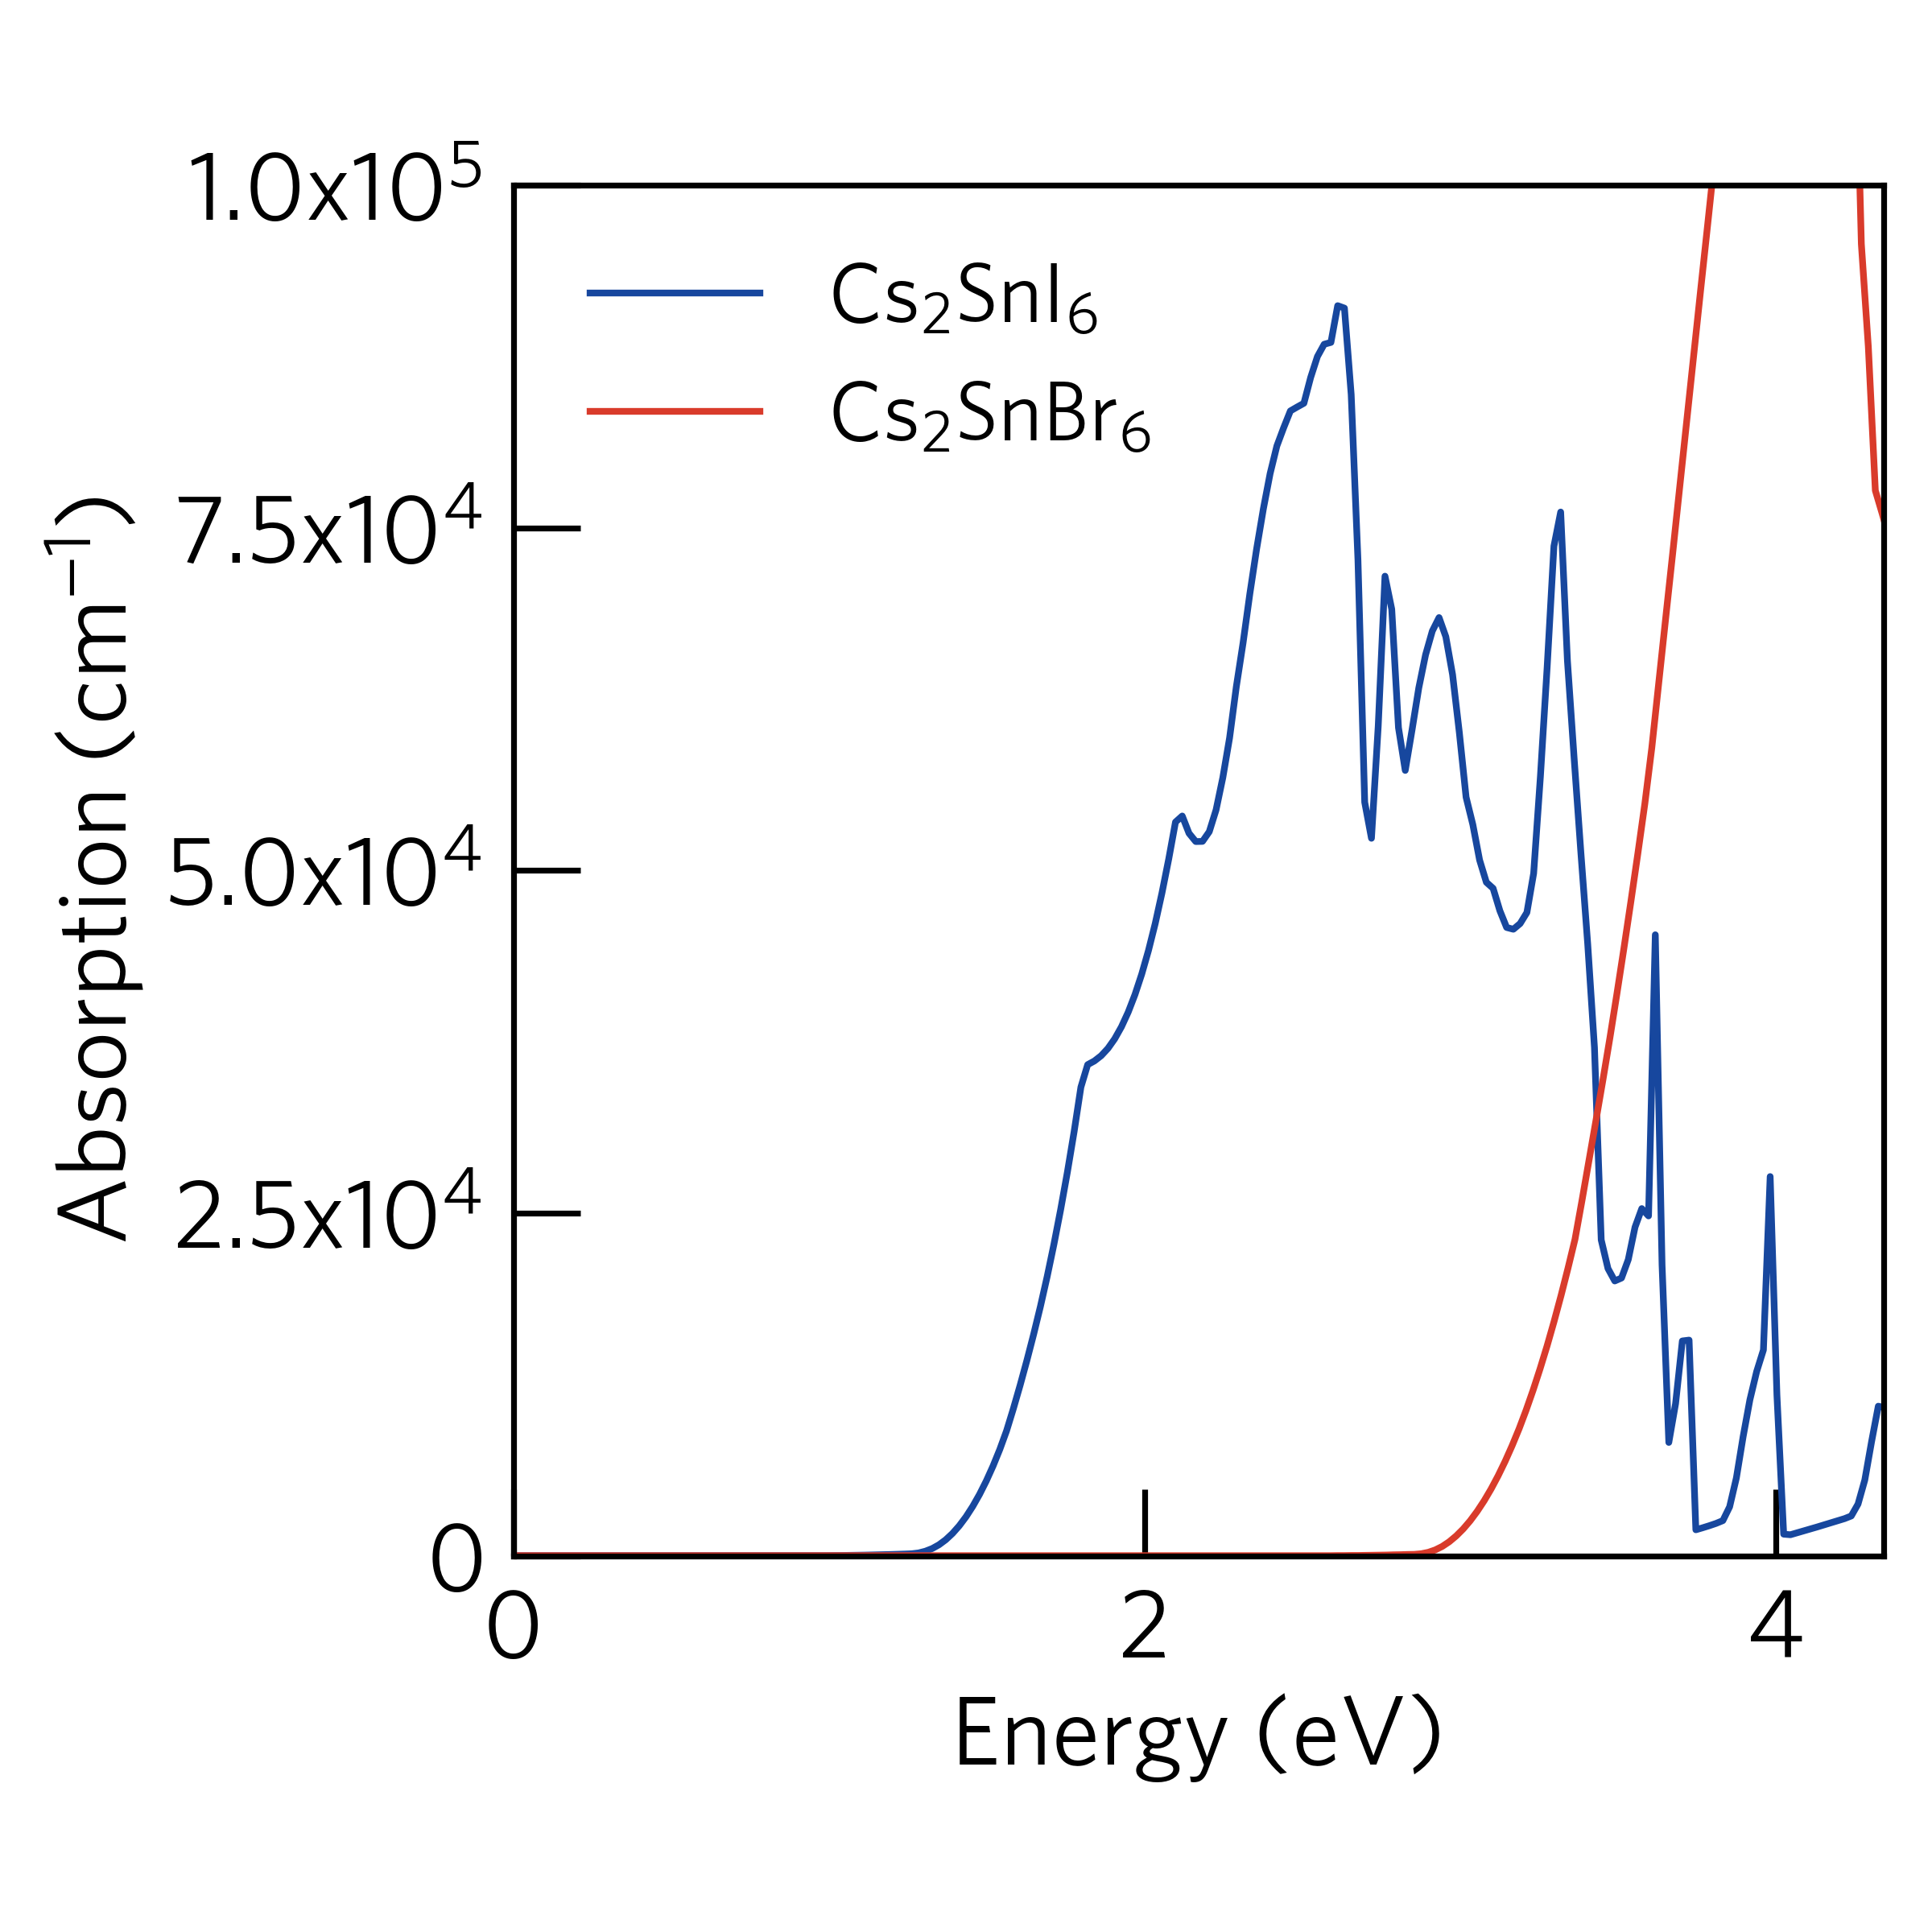
Plotting Multiple Spectra
Multiple absorption spectra can be plotted simultaneously by specifying multiple
vasprun.xml files using the --filenames option.
A label will be generated for each system, based on the composition. Alternatively,
the --labels option can be used to provide a name for each system. The number
of vasprun.xml files must be equivalent for the number of labels.
For example, if we run the following command in the sumo/tests/data/Cs2SnI6/optics directory,
the plot should look like:
sumo-optplot --filenames vasprun.xml.gz ../../Cs2SnBr6/vasprun.xml.gz
This mode also supports plotting the band gap of each compound using the --bandgap option.
Questaal
LMTO optics calculations with the lmf program are supported;
when OPTICS MODE=1 (or greater) in the ctrl.ext file an
opt.ext file is written with the imaginary dielectric function vs
energy in Ry. Sumo can import this file and compute a real component
with the Kramers-Kronig relation; this provides the information
needed for plotting optical properties. To plot the optical absorption:
sumo-optplot --code questaal -f opt.ext
The opt_BSE.out file from bethesalpeter calculations is also
supported; this format will be detected as long as “opt_BSE” is
somewhere in the filename.
Command-Line Interface
optplot is a script to produce optical absorption spectra diagrams
usage: sumo-optplot [-h] [-f F [F ...]] [-p P] [-d D] [-c C [C ...]] [-g G]
                    [-b [E ...]] [-l L [L ...]] [-a] [--height HEIGHT]
                    [--width WIDTH] [--xmin XMIN] [--xmax XMAX]
                    [--ymin YMIN [YMIN ...]] [--ymax YMAX [YMAX ...]]
                    [--style STYLE [STYLE ...]] [--no-base-style]
                    [--format FORMAT] [--dpi DPI] [--font FONT]
                    [--units UNITS]
                    [M ...]
Positional Arguments
- M
Possible choices: eps_imag, absorption, n_imag, n_real, eps_real, loss
Optical properties to plot. Multiple choices will be displayed as subplots. Accepted values: “absorption” (optical absorption over distance), “loss” (energy-loss function -Im(1/eps)), “eps_real” and “eps_imag” (real and imaginary parts of the dielectric function), “n_real” (real part of complex refractive index)”n_imag” (imaginary part of RI, also known as the extinction coefficient kappa.)
Default:
'absorption'
Named Arguments
- -f, --filenames
path to one or more vasprun.xml files
- -p, --prefix
prefix for the files generated
- -d, --directory
output directory for files
- -c, --code
Original calculator. Accepted values are “vasp” and “questaal”.
Default:
'vasp'- -g, --gaussian
standard deviation of gaussian broadening
- -b, --bandgaps
indicate the fundamental band gap (options: nothing, vasprun.xml file, or float). A sequence of files and values may be provided, corresponding to the optical data files. To skip a line, set a value outside the plot range (e.g. -1).
- -l, --labels
labels for the absorption specta
- -a, --anisotropic
separate spectra into to x, y, and z directions
Default:
True- --height
height of the graph
- --width
width of the graph
- --xmin
minimum energy on the x-axis
Default:
0.0- --xmax
maximum energy on the x-axis
- --ymin
minimum intensity on the y-axis; may specify multiple values if plotting more than one axis. Use “auto” or “_” for automatic value.
Default:
['auto']- --ymax
maximum intensity on the y-axis; may specifymultiple values if plotting more than one axis. Use “auto” or “_” for automatic value.
Default:
['auto']- --style
matplotlib style specifications
- --no-base-style
prevent use of sumo base style
Default:
False- --format
image file format (options: pdf, svg, jpg, png)
Default:
'pdf'- --dpi
pixel density for image file
Default:
400- --font
font to use
- --units
x-axis units (options: eV or nm)
Default:
'eV'
Author: Alex Ganose Version: 1.0 Last updated: Jan 10, 2018